พื้นฐานของ k-means clustering

การวิเคราะห์กลุ่มข้อมูลใน Python

Shaumik Daityari

Business Analyst

ทำไมต้องใช้ k-means clustering?

  • ข้อเสียสำคัญของ hierarchical clustering: เวลาในการรัน
  • K-means ทำงานเร็วกว่ามากบนชุดข้อมูลขนาดใหญ่
การวิเคราะห์กลุ่มข้อมูลใน Python

ขั้นตอนที่ 1: สร้างจุดศูนย์กลาง cluster

kmeans(obs, k_or_guess, iter, thresh, check_finite)
  • obs: ข้อมูลที่ผ่านการ standardize แล้ว
  • k_or_guess: จำนวน cluster
  • iter: จำนวนรอบการวนซ้ำ (ค่าเริ่มต้น: 20)
  • thres: ค่า threshold (ค่าเริ่มต้น: 1e-05)
  • check_finite: ตรวจสอบว่าข้อมูลมีเฉพาะตัวเลขจำกัดหรือไม่ (ค่าเริ่มต้น: True)

คืนค่าสองอย่าง: จุดศูนย์กลาง cluster และค่า distortion

การวิเคราะห์กลุ่มข้อมูลใน Python

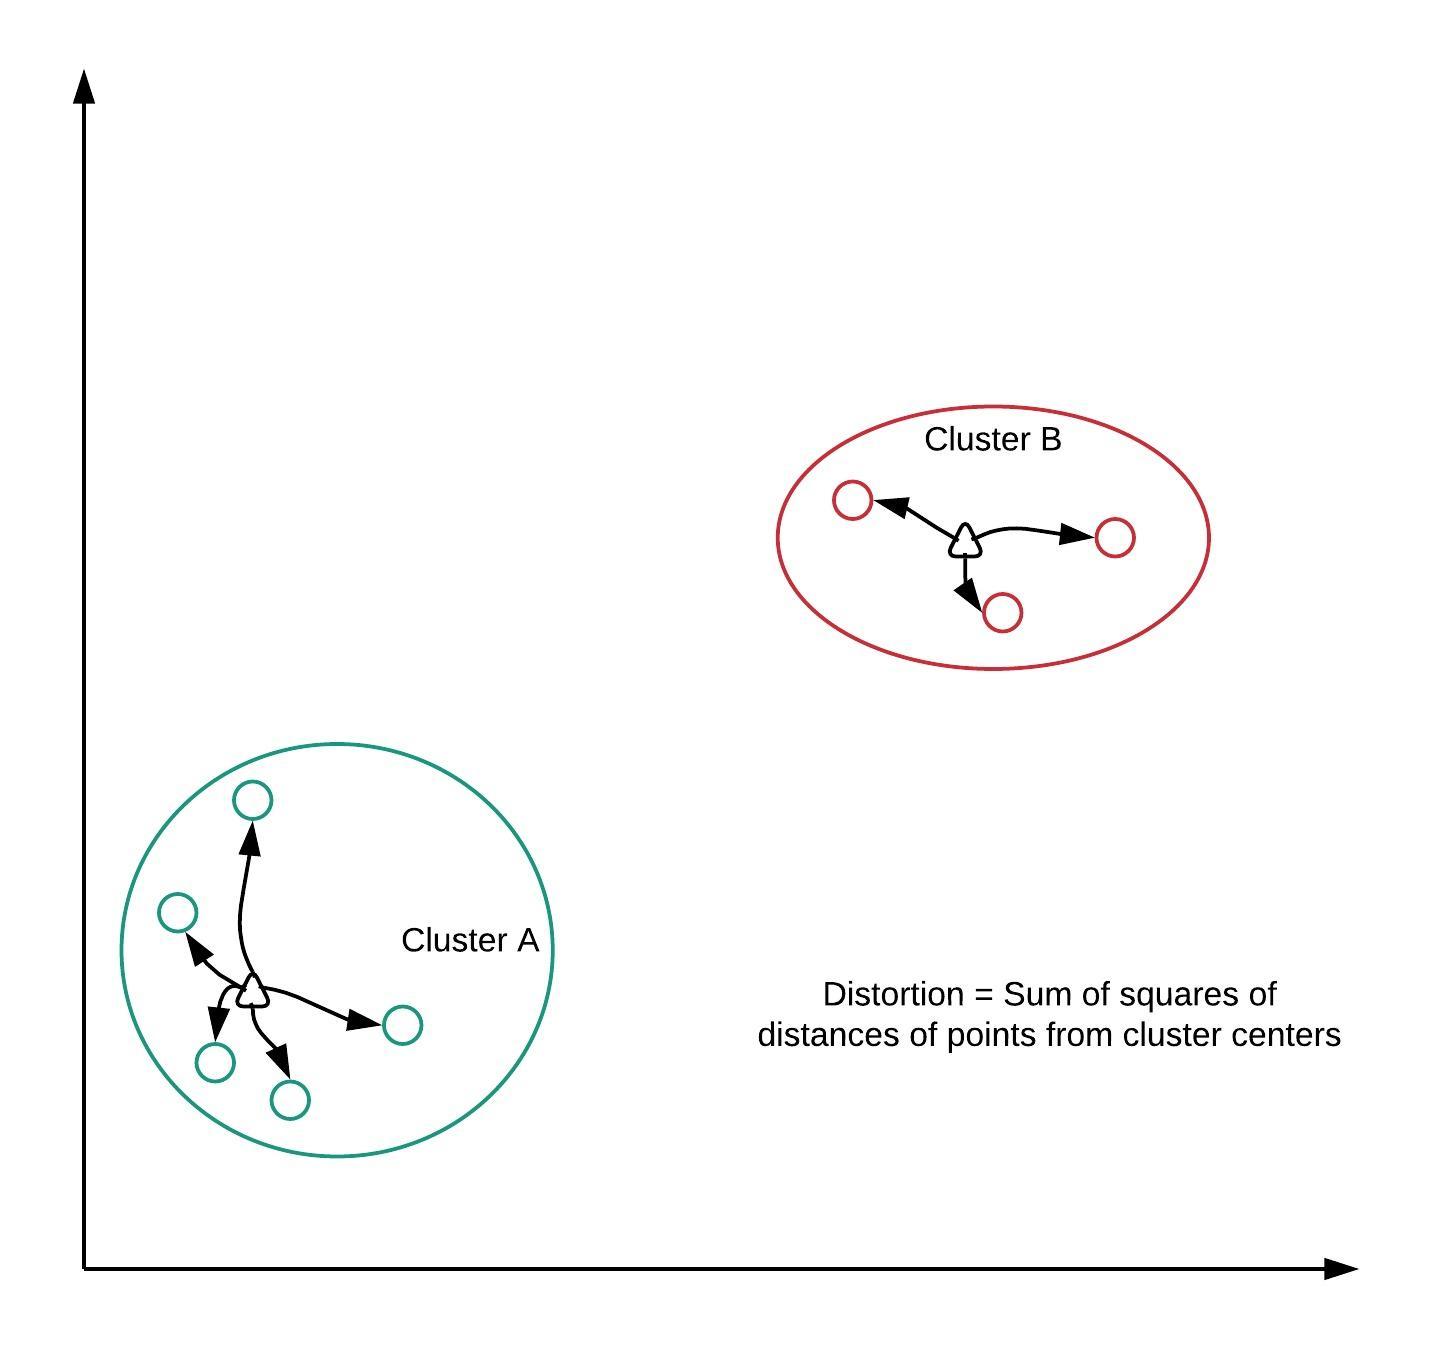
ค่า distortion คำนวณอย่างไร?

การวิเคราะห์กลุ่มข้อมูลใน Python

ขั้นตอนที่ 2: สร้าง label ของ cluster

vq(obs, code_book, check_finite=True)
  • obs: ข้อมูลที่ผ่านการ standardize แล้ว
  • code_book: จุดศูนย์กลาง cluster
  • check_finite: ตรวจสอบว่าข้อมูลมีเฉพาะตัวเลขจำกัดหรือไม่ (ค่าเริ่มต้น: True)

คืนค่าสองอย่าง: รายการ label ของ cluster และรายการค่า distortion

การวิเคราะห์กลุ่มข้อมูลใน Python

หมายเหตุเกี่ยวกับค่า distortion

  • kmeans คืนค่า distortion เพียงค่าเดียว
  • vq คืนค่าเป็นรายการของค่า distortion
การวิเคราะห์กลุ่มข้อมูลใน Python

การรัน k-means

# Import kmeans and vq functions
from scipy.cluster.vq import kmeans, vq
# Generate cluster centers and labels
cluster_centers, _ = kmeans(df[['scaled_x', 'scaled_y']], 3)
df['cluster_labels'], _ = vq(df[['scaled_x', 'scaled_y']], cluster_centers)
# Plot clusters
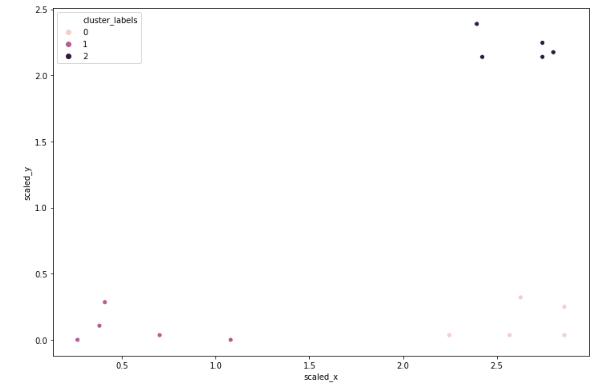
sns.scatterplot(x='scaled_x', y='scaled_y', hue='cluster_labels', data=df)
plt.show()
การวิเคราะห์กลุ่มข้อมูลใน Python

การวิเคราะห์กลุ่มข้อมูลใน Python

มาฝึกกันเถอะ!

การวิเคราะห์กลุ่มข้อมูลใน Python

Preparing Video For Download...