# Convert to dataframe for hive plots and add weights
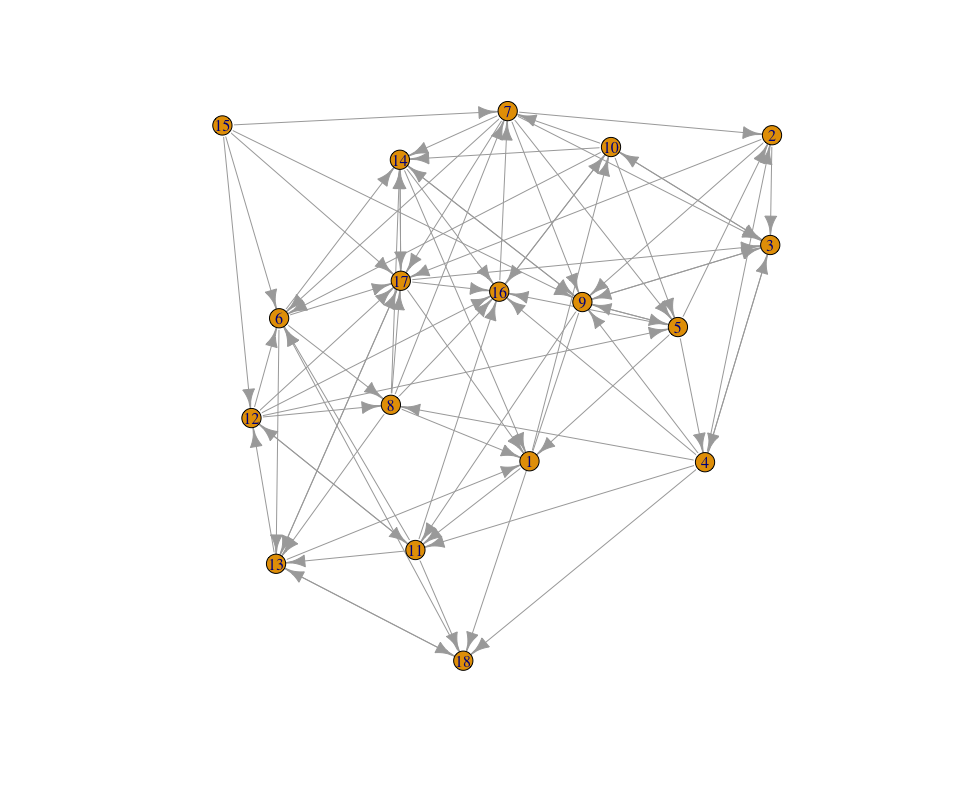
rand_g_df <- as.data.frame(get.edgelist(rand_g))
rand_g_df$weight <- 1
# Convert to hive object
rand_hive <- edge2HPD(edge_df = rand_g_df)
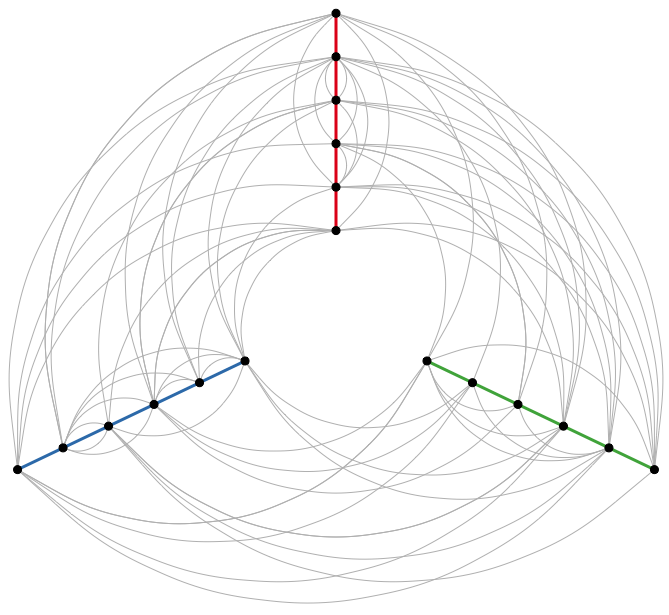
# Set the axis and the radius of each node
rand_hive$nodes$axis <- sort(rep(1:3, 6))
rand_hive$nodes$radius <- as.double(rep(1:6, 3))
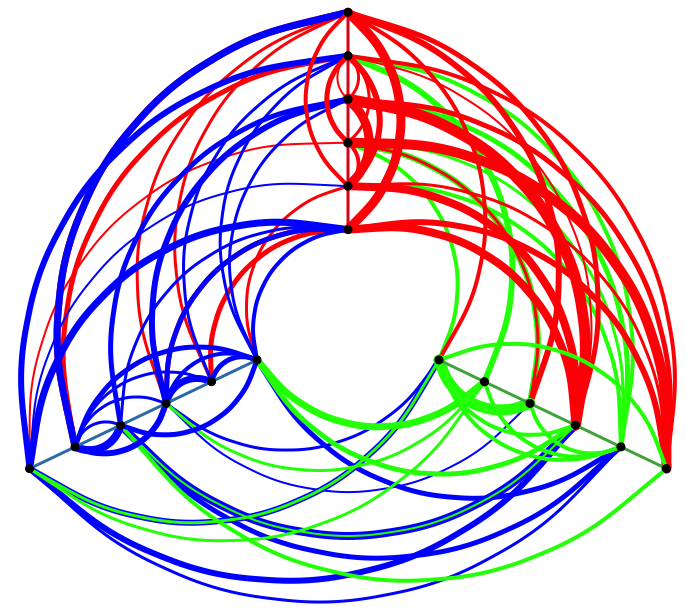
Introduction to hive plots
# See how nodes are modified
rand_hive$nodes
id lab axis radius size color
1   2    1      1    1 black
2   8    1      2    1 black
3   9    1      3    1 black
4   3    1      4    1 black
5   4    1      5    1 black
6   7    1      6    1 black
7  11    2      1    1 black
8  14    2      2    1 black
9  18    2      3    1 black