Connectivity
Case Studies: Network Analysis in R

Edmund Hart
Instructor
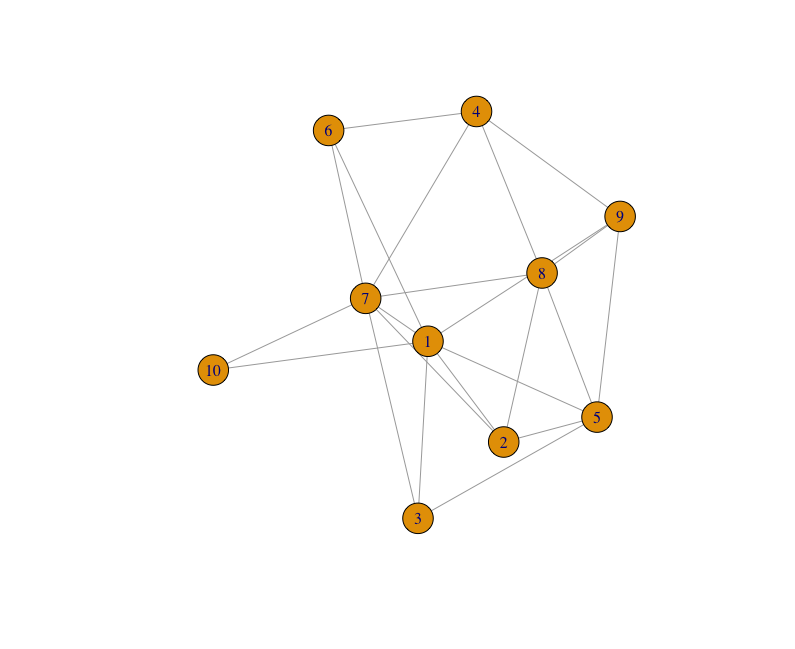
Measuring connectivity
rand_g <- erdos.renyi.game(10, 0.4, "gnp", directed = FALSE)
plot(rand_g)
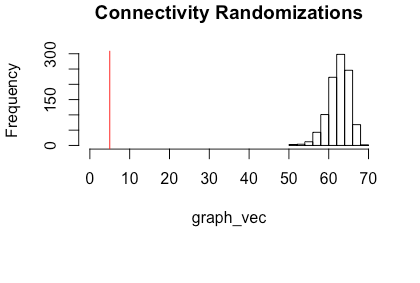
Connectivity randomizations
# Find actual connectivity
econn <- edge_connectivity(trip_g_ud)
hist(graph_vec, xlim = c(0, 140))
abline(v = edge_connectivity(trip_g_ud))