Case Studies: Network Analysis in R
Edmund Hart
Instructor
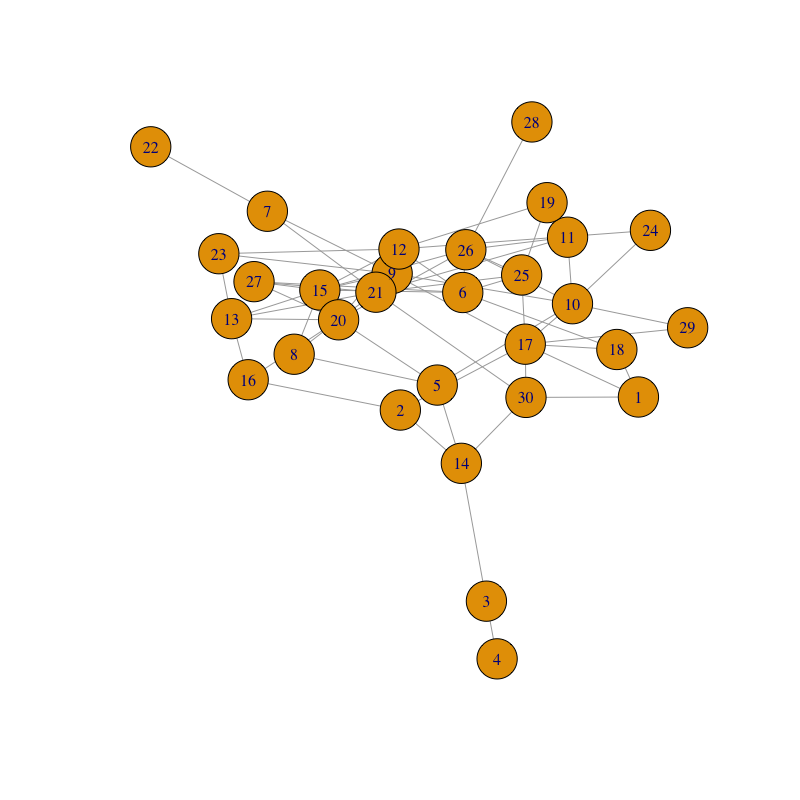
library(ggnetwork)
library(igraph)
library(GGally)
library(intergraph)

rand_g <- erdos.renyi.game(30, .15, "gnp", directed = F)
rand_g <- simplify(rand_g)

plot(rand_g)
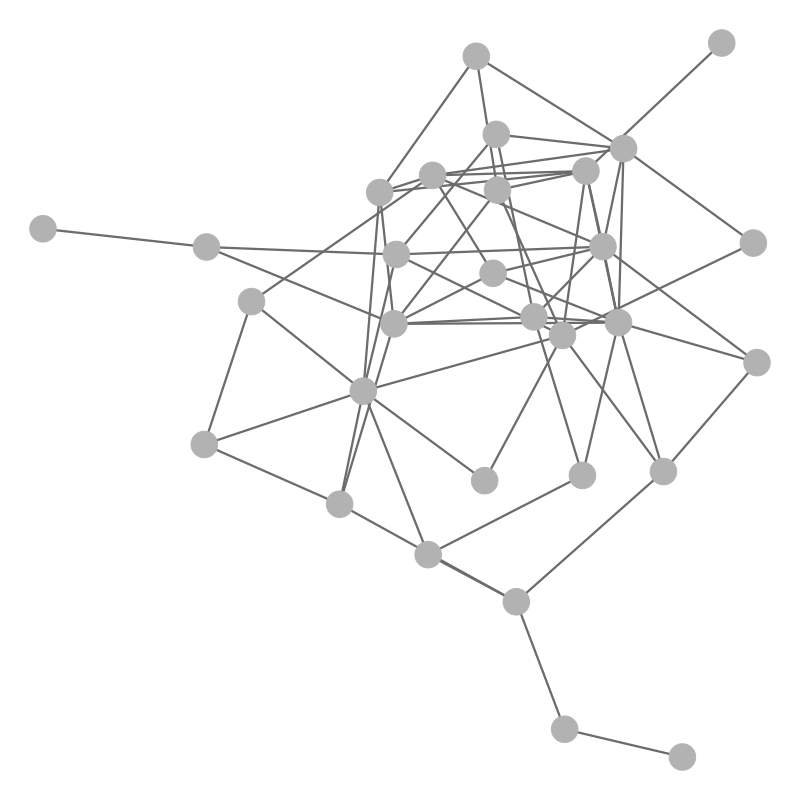
net <- asNetwork(rand_g)
ggnet2(net)
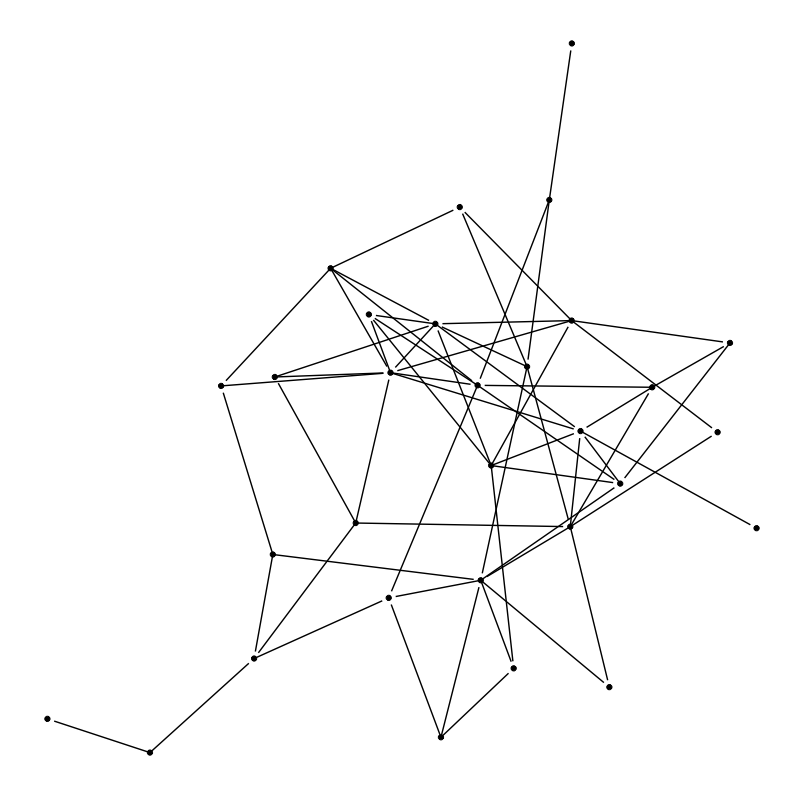
gn <- ggnetwork(rand_g)

g <- ggplot(gn, aes(x = x, y = y, xend = xend, yend = yend)) +
        geom_edges() +
        geom_nodes() +
        theme_blank()

head(gn)
gn <- ggnetwork(rand_g)
g <- ggplot(gn, aes(x = x, y = y, xend = xend, yend = yend)) + geom_edges() + geom_nodes() + theme_blank()
head(gn)
          x          y  na.x vertex.names      xend       yend na.y
1 0.4729841 0.01697675 FALSE            1 0.4729841 0.01697675   NA
2 0.1883442 0.42284666 FALSE            2 0.1883442 0.42284666   NA
3 0.3485247 0.82865654 FALSE            3 0.3485247 0.82865654   NA
4 0.3905894 1.00000000 FALSE            4 0.3905894 1.00000000   NA
plot(g)
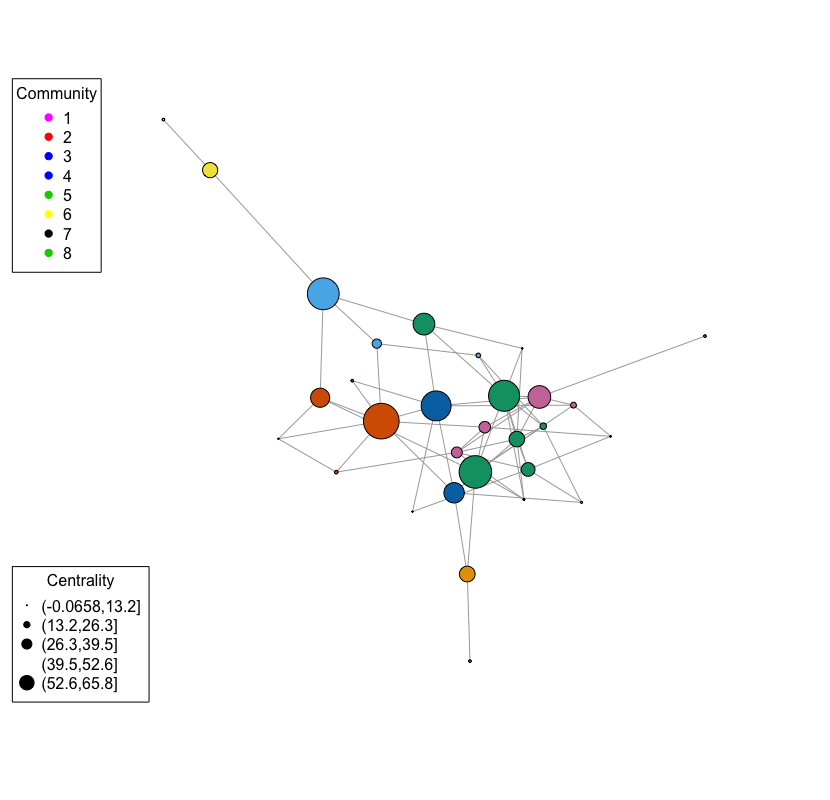
# Add attributes
V(rand_g)$cent <- betweenness(rand_g)
V(rand_g)$comm <- membership(cluster_walktrap(rand_g))

# Make plot
plot(rand_g, vertex.label = NA, margin = 0,
     vertex.color = V(rand_g)$comm,
     vertex.size = V(rand_g)$cent / 6)

# Add legend for community membership
legend('topleft', legend= sort(unique( V(rand_g)$comm)),
col=  sort(unique(V(rand_g)$comm)), pch = 19, title = "Community")

# Add cuts and then get quantiles for size legend
cc <- cut(V(rand_g)$cent, 5)
scaled <- quantile(V(rand_g)$cent, seq(0.3, 0.9, length = 5)) / 25

# Add size legend for centrality
legend('bottomleft', legend= levels(cc),
  pt.cex = scaled, pch = 19, title = "Centrality")
# Add attributes V(rand_g)$cent <- betweenness(rand_g) V(rand_g)$comm <- membership(cluster_walktrap(rand_g))
# Make plot plot(rand_g, vertex.label = NA, margin = 0, vertex.color = V(rand_g)$comm, vertex.size = V(rand_g)$cent / 6)
# Add legend for community membership legend('topleft', legend= sort(unique( V(rand_g)$comm)), col= sort(unique(V(rand_g)$comm)), pch = 19, title = "Community")
# Add cuts and then get quantiles for size legend cc <- cut(V(rand_g)$cent, 5) scaled <- quantile(V(rand_g)$cent, seq(0.3, 0.9, length = 5)) / 25
# Add size legend for centrality legend('bottomleft', legend= levels(cc), pt.cex = scaled, pch = 19, title = "Centrality")
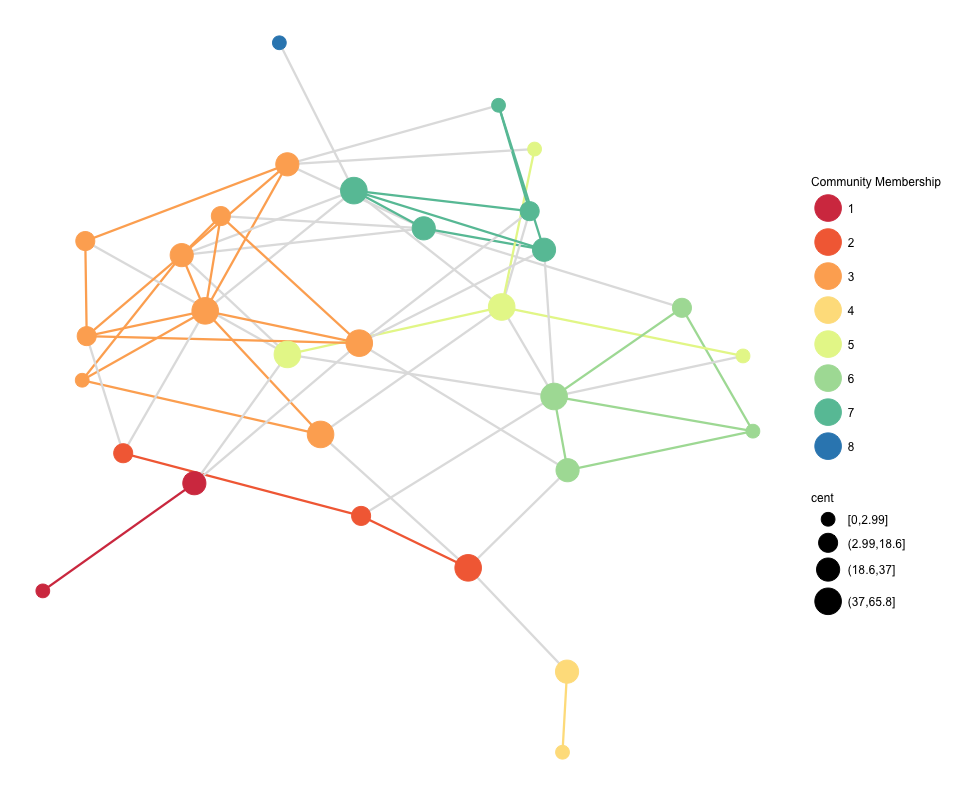
net <- asNetwork(rand_g)

ggnet2(net,
       node.size = "cent",
       node.color = "comm",
       edge.size = 0.8,
       color.legend = "Community Membership",
       color.palette = "Spectral",
       edge.color = c("color", "gray88"),
       size.cut = TRUE,
       size.legend = "Centrality")
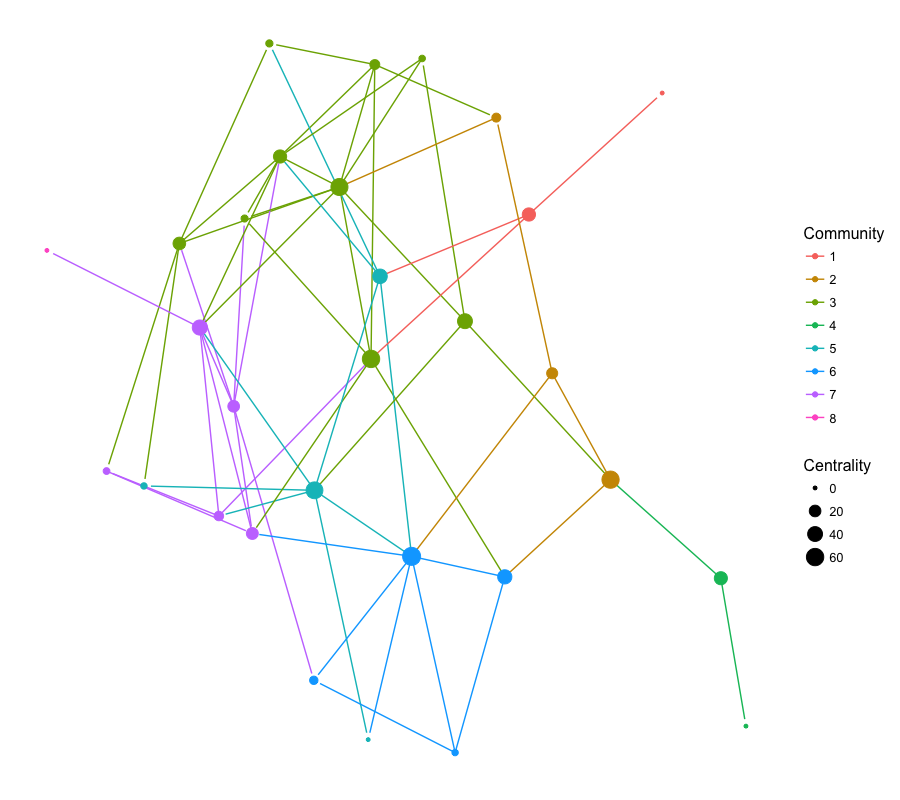
gn <- ggnetwork(rand_g)

g <- ggplot(gn, aes(x = x, y = y, xend = xend, yend = yend)) +
  geom_edges(aes(color = as.factor(comm))) +
  geom_nodes(aes(color = as.factor(comm), size = cent)) +
  theme_blank()  +
  guides(
    color = guide_legend(title = "Community"),
    size = guide_legend(title = "Centrality"))

plot(g)