การกำหนดสมมติฐานและการแจกแจง

A/B Testing ด้วย Python

Moe Lotfy, PhD

Principal Data Science Manager

การนิยามสมมติฐาน

  • สมมติฐาน คือ:

    • ข้อความที่อธิบายเหตุการณ์หนึ่ง
    • จุดเริ่มต้นสำหรับการศึกษาเพิ่มเติม
    • แนวคิดที่ต้องการทดสอบ
  • สมมติฐานที่ดีควร:

    • ทดสอบได้ ชัดเจน กระชับ และมีเหตุผล
    • รองรับการทำซ้ำเชิงระบบ
    • ทำให้ตรวจสอบและสรุปผลได้ง่ายขึ้น
    • นำไปสู่ข้อเสนอแนะที่เจาะจงและนำไปใช้ได้จริง
A/B Testing ด้วย Python

รูปแบบสมมติฐาน

  • รูปแบบการกำหนดสมมติฐานทั่วไป:

    • จากข้อมูล X เราเชื่อว่าหากทำ Y
    • แล้ว Z จะเกิดขึ้น
    • โดยวัดจากเมตริก M
  • ตัวอย่างสมมติฐานทางเลือก:

    • จากการวิจัยประสบการณ์ผู้ใช้ เราเชื่อว่าหากปรับปรุงการออกแบบหน้าชำระเงิน
    • แล้วสัดส่วนลูกค้าที่ซื้อสินค้าจะเพิ่มขึ้น
    • โดยวัดจากอัตราการซื้อ
  • สมมติฐานหลัก: ...สัดส่วนลูกค้าที่ซื้อสินค้าจะไม่เปลี่ยนแปลง...
A/B Testing ด้วย Python

การคำนวณสถิติของกลุ่มตัวอย่าง

# Calculate the number of users in groups A and B
n_A = checkout[checkout['checkout_page'] == 'A']['purchased'].count()
n_B = checkout[checkout['checkout_page'] == 'B']['purchased'].count()
print('Group A users:',n_A)
print('Group B users:',n_B)
Group A users: 3000
Group B users: 3000
# Calculate the mean purchase rates of groups A and B
p_A = checkout[checkout['checkout_page'] == 'A']['purchased'].mean()
p_B = checkout[checkout['checkout_page'] == 'B']['purchased'].mean()
print('Group A mean purchase rate:',p_A)
print('Group B mean purchase rate:',p_B)
Group A mean purchase rate: 0.820
Group B mean purchase rate: 0.847
A/B Testing ด้วย Python

การจำลองและพล็อตการแจกแจง

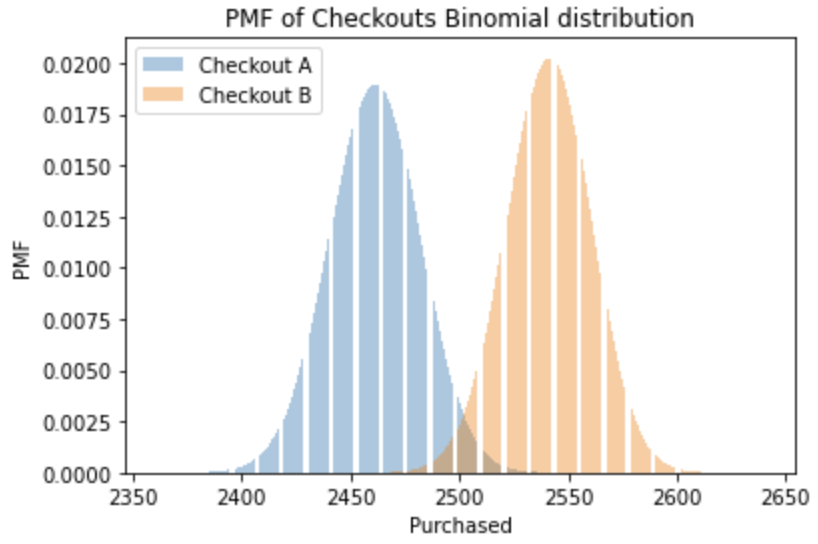
จำนวนผู้ซื้อใน n การทดลอง ที่มีความน่าจะเป็นในการซื้อ p จะมีการแจกแจงแบบทวินาม

# Import binom from scipy library 
from scipy.stats import binom 
# Create x-axis range and Binomial distributions A and B
x = np.arange(n_A*p_A - 100, n_B*p_B + 100) 
binom_a = binom.pmf(x, n_A, p_A)
binom_b = binom.pmf(x, n_B, p_B) 
# Plot Binomial distributions A and B
plt.bar(x, binom_a, alpha=0.4, label='Checkout A')
plt.bar(x, binom_b, alpha=0.4, label='Checkout B')
plt.xlabel('Purchased')
plt.ylabel('PMF')
plt.title('PMF of Checkouts Binomial distribution')
plt.show()

การแจกแจงทวินามของกลุ่ม A และ B ในหน้าชำระเงิน

A/B Testing ด้วย Python

ทฤษฎีบทลิมิตกลาง

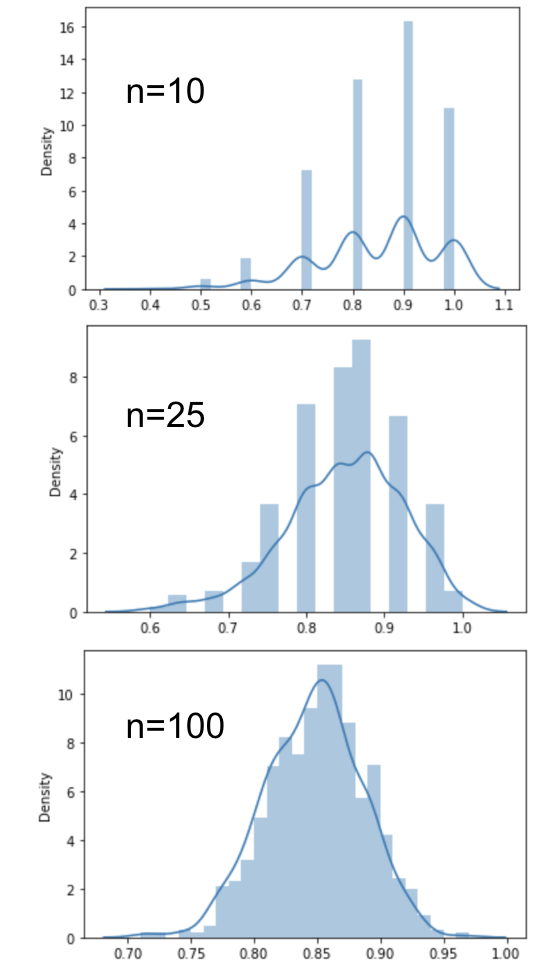
เมื่อขนาดกลุ่มตัวอย่างใหญ่เพียงพอ การแจกแจงของค่าเฉลี่ยกลุ่มตัวอย่าง p จะ

  • มีการแจกแจงแบบปกติรอบค่าเฉลี่ยประชากรจริง
  • โดยมีส่วนเบี่ยงเบนมาตรฐานเท่ากับค่าความคลาดเคลื่อนมาตรฐานของค่าเฉลี่ย
  • โดยไม่ขึ้นอยู่กับการแจกแจงของข้อมูลต้นทาง
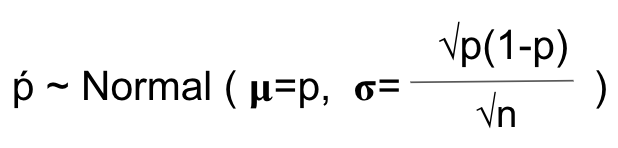
สูตรทฤษฎีบทลิมิตกลางสำหรับสัดส่วน

A/B Testing ด้วย Python

ทฤษฎีบทลิมิตกลางใน Python

# Set random seed for repeatability 
np.random.seed(47)
# Create an empty list to hold means
sampled_means = []
# Create loop to simulate 1000 sample means
for i in range(1000):
    # Take a sample of n=100
    sample = checkout['purchased'].sample(100,replace=True)
    # Get the sample mean and append to list
    sample_mean = np.mean(sample)
    sampled_means.append(sample_mean)
# Plot distribution
sns.displot(sampled_means, kde=True)
plt.show()

การสาธิตทฤษฎีบทลิมิตกลางด้วย Python การแจกแจงจะเข้าใกล้การแจกแจงปกติเมื่อขนาดกลุ่มตัวอย่างใหญ่ขึ้น

A/B Testing ด้วย Python

การแทนสมมติฐานด้วยคณิตศาสตร์

# Import norm from scipy library 
from scipy.stats import norm
# Create x-axis range and normal distributions A and B
x = np.linspace(0.775, 0.9, 500)
norm_a = norm.pdf(x, p_A, np.sqrt(p_A*(1-p_A) / n_A))
norm_b = norm.pdf(x, p_B, np.sqrt(p_B*(1-p_B) / n_B))
# Plot normal distributions A and B
sns.lineplot(x=x, y=norm_a, ax=ax, label='Checkout A')
sns.lineplot(x=x, y=norm_b, color='orange', \
             ax=ax, label= 'Checkout B')
ax.axvline(p_A, linestyle='--')
ax.axvline(p_B, linestyle='--')
plt.xlabel('Purchased Proportion')
plt.ylabel('PDF')
plt.legend(loc="upper left")
plt.show()

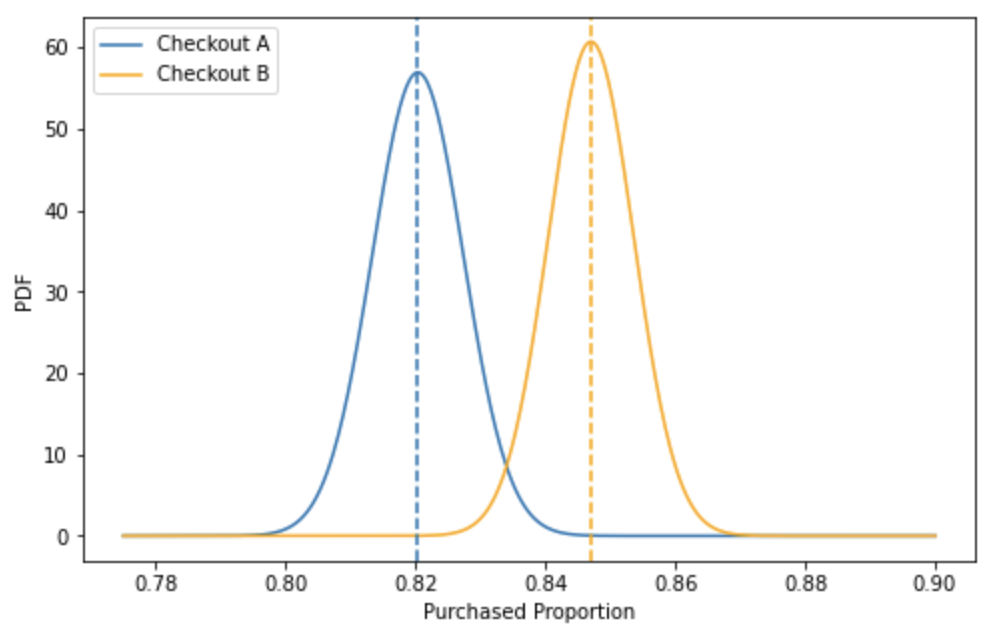
กราฟความแตกต่างของค่าเฉลี่ยสำหรับสมมติฐานหลักและสมมติฐานทางเลือก

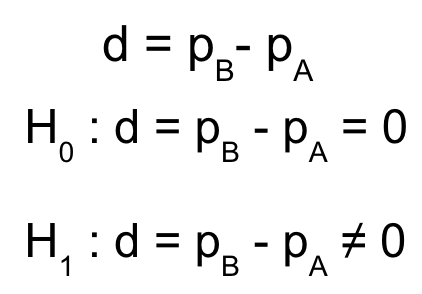
สูตรทางคณิตศาสตร์ของสมมติฐานหลักและสมมติฐานทางเลือก

A/B Testing ด้วย Python

มาฝึกกันเถอะ!

A/B Testing ด้วย Python

Preparing Video For Download...