ตัวแปรอธิบายมากกว่าสองตัว

Regression ระดับกลางด้วย statsmodels ใน Python

Maarten Van den Broeck

Content Developer at DataCamp

ทบทวนจากครั้งที่แล้ว
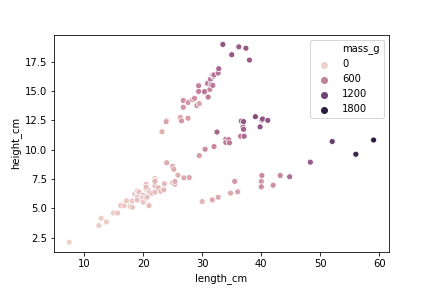
sns.scatterplot(x="length_cm", 
                y="height_cm",
                data=fish,
                hue="mass_g")

กราฟกระจายแบบ 2D โดยใช้สีแทนตัวแปรตัวเลขที่สาม

Regression ระดับกลางด้วย statsmodels ใน Python

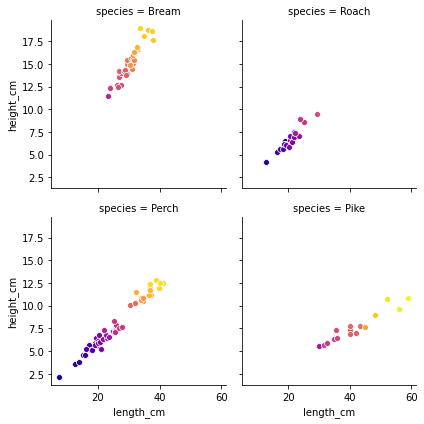
การแยกแฟซ็ตตามชนิดปลา

grid = sns.FacetGrid(data=fish,

col="species",
hue="mass_g", col_wrap=2,
palette="plasma")
grid.map(sns.scatterplot,
         "length_cm",
         "height_cm")
plt.show()

กราฟกระจายของความสูง ความยาว และมวลของปลา แยกแฟซ็ตตามชนิด โดยสีที่สว่างกว่าหมายถึงปลาที่หนักกว่า

Regression ระดับกลางด้วย statsmodels ใน Python

การแยกแฟซ็ตตามชนิดปลา

  • สามารถใช้ตัวแปรกลุ่มมากกว่าหนึ่งตัวในการแยกแฟซ็ตได้
  • ระวังการใช้แฟซ็ตมากเกินไป
  • ยิ่งมีตัวแปรมาก การพล็อตยิ่งซับซ้อนขึ้น

กราฟกระจายของความสูง ความยาว และมวลของปลา แยกแฟซ็ตตามชนิด โดยสีที่สว่างกว่าหมายถึงปลาที่หนักกว่า

Regression ระดับกลางด้วย statsmodels ใน Python

ระดับของ interaction ที่แตกต่างกัน

ไม่มี interaction

ols("mass_g ~ length_cm + height_cm + species + 0", data=fish).fit()

interaction แบบสองทางระหว่างคู่ตัวแปร

ols(
  "mass_g ~ length_cm + height_cm + species +
  length_cm:height_cm + length_cm:species + height_cm:species + 0", data=fish).fit()

interaction แบบสามทางระหว่างตัวแปรทั้งสาม

ols(
  "mass_g ~ length_cm + height_cm + species + 
  length_cm:height_cm + length_cm:species + height_cm:species + length_cm:height_cm:species + 0", data=fish).fit()
Regression ระดับกลางด้วย statsmodels ใน Python

ครบทุก interaction

ols(
  "mass_g ~ length_cm + height_cm + species + 
  length_cm:height_cm + length_cm:species + height_cm:species + length_cm:height_cm:species + 0", 
  data=fish).fit()

เทียบเท่ากับ

ols(
  "mass_g ~ length_cm * height_cm * species + 0", 
  data=fish).fit()
Regression ระดับกลางด้วย statsmodels ใน Python

เฉพาะ interaction แบบสองทาง

ols(
  "mass_g ~ length_cm + height_cm + species + 
  length_cm:height_cm + length_cm:species + height_cm:species + 0", 
  data=fish).fit()

เทียบเท่ากับ

ols(
  "mass_g ~ (length_cm + height_cm + species) ** 2 + 0", 
  data=fish).fit()
Regression ระดับกลางด้วย statsmodels ใน Python

ขั้นตอนการพยากรณ์

mdl_mass_vs_all = ols(
  "mass_g ~ length_cm * height_cm * species + 0",
  data=fish).fit()

length_cm = np.arange(5, 61, 5)
height_cm = np.arange(2, 21, 2)
species = fish["species"].unique()

p = product(length_cm, height_cm, species)

explanatory_data = pd.DataFrame(p,
                                columns=["length_cm",
                                         "height_cm",
                                         "species"])

prediction_data = explanatory_data.assign(
  mass_g = mdl_mass_vs_all.predict(explanatory_data))

print(prediction_data)
     length_cm  height_cm species       mass_g
0            5          2   Bream  -570.656437
1            5          2   Roach    31.449145
2            5          2   Perch    43.789984
3            5          2    Pike   271.270093
4            5          4   Bream  -451.127405
..         ...        ...     ...          ...
475         60         18    Pike  2690.346384
476         60         20   Bream  1531.618475
477         60         20   Roach  2621.797668
478         60         20   Perch  3041.931709
479         60         20    Pike  2926.352397

[480 rows x 4 columns]
Regression ระดับกลางด้วย statsmodels ใน Python

มาฝึกกันเถอะ!

Regression ระดับกลางด้วย statsmodels ใน Python

Preparing Video For Download...