การทำนายด้วย interaction
Regression ระดับกลางด้วย statsmodels ใน Python

Maarten Van den Broeck
Content Developer at DataCamp
โมเดลที่มี interaction
mdl_mass_vs_both_inter = ols("mass_g ~ species + species:length_cm + 0",
                             data=fish).fit()

print(mdl_mass_vs_both_inter.params)
species[Bream]             -1035.3476
species[Perch]              -619.1751
species[Pike]              -1540.8243
species[Roach]              -329.3762
species[Bream]:length_cm      54.5500
species[Perch]:length_cm      38.9115
species[Pike]:length_cm       53.1949
species[Roach]:length_cm      23.3193
ขั้นตอนการทำนาย
from itertools import product

length_cm = np.arange(5, 61, 5)

species = fish["species"].unique()

p = product(length_cm, species)
explanatory_data = pd.DataFrame(p,
                                columns=["length_cm",
                                         "species"])

prediction_data = explanatory_data.assign(
 mass_g = mdl_mass_vs_both_inter.predict(explanatory_data))
print(prediction_data)
    length_cm species     mass_g
0           5   Bream  -762.5977
1           5   Roach  -212.7799
2           5   Perch  -424.6178
3           5    Pike -1274.8499
4          10   Bream  -489.8478
5          10   Roach   -96.1836
6          10   Perch  -230.0604
7          10    Pike -1008.8756
8          15   Bream  -217.0979
...
40         55   Bream  1964.9014
41         55   Roach   953.1833
42         55   Perch  1520.9556
43         55    Pike  1384.8933
44         60   Bream  2237.6513
45         60   Roach  1069.7796
46         60   Perch  1715.5129
47         60    Pike  1650.8677
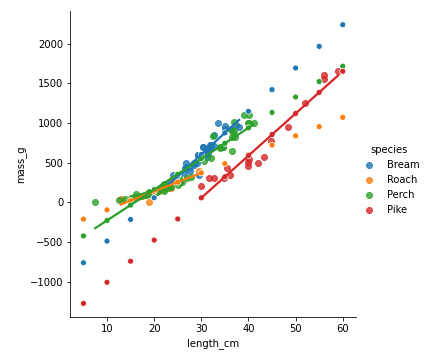
การแสดงผลค่าทำนาย
sns.lmplot(x="length_cm",
           y="mass_g",
           data=fish,
           hue="species",
           ci=None)

sns.scatterplot(x="length_cm",
                y="mass_g",
                data=prediction_data,
                hue="species")

plt.show()
การคำนวณค่าทำนายด้วยตนเอง
coeffs = mdl_mass_vs_both_inter.params
species[Bream]             -1035.3476
species[Perch]              -619.1751
species[Pike]              -1540.8243
species[Roach]              -329.3762
species[Bream]:length_cm      54.5500
species[Perch]:length_cm      38.9115
species[Pike]:length_cm       53.1949
species[Roach]:length_cm      23.3193
ic_bream, ic_perch, ic_pike, ic_roach,
slope_bream, slope_perch, slope_pike, slope_roach = coeffs
การคำนวณค่าทำนายด้วยตนเอง
conditions = [ explanatory_data["species"] == "Bream", explanatory_data["species"] == "Perch", explanatory_data["species"] == "Pike", explanatory_data["species"] == "Roach" ]ic_choices = [ic_bream, ic_perch, ic_pike, ic_roach]intercept = np.select(conditions, ic_choices)slope_choices = [slope_bream, slope_perch, slope_pike, slope_roach]slope = np.select(conditions, slope_choices)
การคำนวณค่าทำนายด้วยตนเอง
prediction_data = explanatory_data.assign(
 mass_g = intercept + slope * explanatory_data["length_cm"])

print(prediction_data)
    length_cm species     mass_g
0           5   Bream  -762.5977
1           5   Roach  -212.7799
2           5   Perch  -424.6178
3           5    Pike -1274.8499
4          10   Bream  -489.8478
5          10   Roach   -96.1836
...
43         55    Pike  1384.8933
44         60   Bream  2237.6513
45         60   Roach  1069.7796
46         60   Perch  1715.5129
47         60    Pike  1650.8677
prediction_data = explanatory_data.assign(
 mass_g = mdl_mass_vs_both_inter.predict(explanatory_data))

print(prediction_data)
    length_cm species     mass_g
0           5   Bream  -762.5977
1           5   Roach  -212.7799
2           5   Perch  -424.6178
3           5    Pike -1274.8499
4          10   Bream  -489.8478
5          10   Roach   -96.1836
...
43         55    Pike  1384.8933
44         60   Bream  2237.6513
45         60   Roach  1069.7796
46         60   Perch  1715.5129
47         60    Pike  1650.8677
มาฝึกกันเถอะ!
Regression ระดับกลางด้วย statsmodels ใน Python

