Прогнозування паралельних нахилів
Середній рівень регресії зі statsmodels у Python

Maarten Van den Broeck
Content Developer at DataCamp
Процес побудови прогнозу
import pandas as pd
import numpy as np
expl_data_length = pd.DataFrame(
  {"length_cm": np.arange(5, 61, 5)})
print(expl_data_length)
    length_cm
0           5
1          10
2          15
3          20
4          25
5          30
6          35
7          40
8          45
9          50
10         55
11         60
Процес побудови прогнозу
[A, B, C] x [1, 2] ==> [A1, B1, C1, A2, B2, C2]
from itertools import productproduct(["A", "B", "C"], [1, 2])
length_cm = np.arange(5, 61, 5)species = fish["species"].unique()p = product(length_cm, species)expl_data_both = pd.DataFrame(p, columns=['length_cm', 'species'])print(expl_data_both)
    length_cm species
0           5   Bream
1           5   Roach
2           5   Perch
3           5    Pike
4          10   Bream
5          10   Roach
6          10   Perch
...
41         55   Roach
42         55   Perch
43         55    Pike
44         60   Bream
45         60   Roach
46         60   Perch
47         60    Pike
Процес побудови прогнозу
Прогнозуйте mass_g лише за length_cm
prediction_data_length = expl_data_length.assign(
    mass_g = mdl_mass_vs_length.predict(expl_data)
)
Прогнозуйте mass_g за обома пояснювальними змінними
prediction_data_both = expl_data_both.assign(
    mass_g = mdl_mass_vs_both.predict(expl_data)
)
    length_cm     mass_g
0           5  -361.7277
1          10  -187.2315
2          15   -12.7353
3          20   161.7610
4          25   336.2572
5          30   510.7534
... # number of rows: 12
    length_cm species     mass_g
0           5   Bream  -459.3991
1           5   Roach  -513.9350
2           5   Perch  -500.4501
3           5    Pike  -876.6133
4          10   Bream  -246.5563
5          10   Roach  -301.0923
... # number of rows: 48
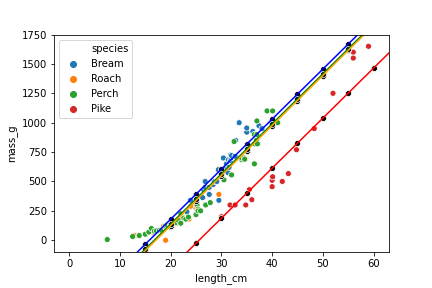
Візуалізація прогнозів
plt.axline(xy1=(0, ic_bream), slope=sl, color="blue")
plt.axline(xy1=(0, ic_perch), slope=sl, color="green")
plt.axline(xy1=(0, ic_pike), slope=sl, color="red")
plt.axline(xy1=(0, ic_roach), slope=sl, color="orange")

sns.scatterplot(x="length_cm",
                y="mass_g",
                hue="species",
                data=fish)
sns.scatterplot(x="length_cm",
                y="mass_g",
                color="black",
                data=prediction_data)
Ручний розрахунок прогнозів для лінійної регресії
coeffs = mdl_mass_vs_length.params
print(coeffs)
intercept, slope = coeffs
explanatory_data = pd.DataFrame(
{"length_cm": np.arange(5, 61, 5)})

prediction_data = explanatory_data.assign(
    mass_g = intercept + slope * explanatory_data
    )
print(prediction_data)
Intercept   -536.223947
length_cm     34.899245
    length_cm       mass_g
0           5  -361.727721
1          10  -187.231494
2          15   -12.735268
3          20   161.760959
4          25   336.257185
5          30   510.753412
...
9          50  1208.738318
10         55  1383.234545
11         60  1557.730771
Ручний розрахунок прогнозів для множинної регресії
coeffs = mdl_mass_vs_both.params
print(coeffs)
species[Bream]    -672.241866
species[Perch]    -713.292859
species[Pike]    -1089.456053
species[Roach]    -726.777799
length_cm           42.568554
ic_bream, ic_perch, ic_pike, ic_roach, slope = coeffs
np.select()
conditions = [
      condition_1,
      condition_2,
      # ...
      condition_n
]

choices = [list_of_choices] # same length as conditions

np.select(conditions, choices)
Вибір перетину за допомогою np.select()
conditions = [
    explanatory_data["species"] == "Bream",
    explanatory_data["species"] == "Perch",
    explanatory_data["species"] == "Pike",
    explanatory_data["species"] == "Roach"
]
choices = [ic_bream, ic_perch, ic_pike, ic_roach]
intercept = np.select(conditions, choices)
print(intercept)
[ -672.24  -726.78  -713.29 -1089.46
  -672.24  -726.78  -713.29 -1089.46
  -672.24  -726.78  -713.29 -1089.46
  -672.24  -726.78  -713.29 -1089.46
  -672.24  -726.78  -713.29 -1089.46
  -672.24  -726.78  -713.29 -1089.46
  -672.24  -726.78  -713.29 -1089.46
  -672.24  -726.78  -713.29 -1089.46
  -672.24  -726.78  -713.29 -1089.46
  -672.24  -726.78  -713.29 -1089.46
  -672.24  -726.78  -713.29 -1089.46
  -672.24  -726.78  -713.29 -1089.46]
Останній крок прогнозу
prediction_data = explanatory_data.assign( intercept = np.select(conditions, choices), mass_g = intercept + slope * explanatory_data["length_cm"])print(prediction_data)
    length_cm species  intercept     mass_g
0           5   Bream  -672.2419  -459.3991
1           5   Roach  -726.7778  -513.9350
2           5   Perch  -713.2929  -500.4501
3           5    Pike -1089.4561  -876.6133
4          10   Bream  -672.2419  -246.5563
5          10   Roach  -726.7778  -301.0923
6          10   Perch  -713.2929  -287.6073
7          10    Pike -1089.4561  -663.7705
8          15   Bream  -672.2419   -33.7136
...
40         55   Bream  -672.2419  1669.0286
41         55   Roach  -726.7778  1614.4927
42         55   Perch  -713.2929  1627.9776
43         55    Pike -1089.4561  1251.8144
44         60   Bream  -672.2419  1881.8714
45         60   Roach  -726.7778  1827.3354
46         60   Perch  -713.2929  1840.8204
47         60    Pike -1089.4561  1464.6572
Порівняння з .predict()
mdl_mass_vs_both.predict(explanatory_data)
0     -459.3991
1     -513.9350
2     -500.4501
3     -876.6133
4     -246.5563
5     -301.0923
...
43    1251.8144
44    1881.8714
45    1827.3354
46    1840.8204
47    1464.6572
Давайте потренуємось!
Середній рівень регресії зі statsmodels у Python

