การตรวจจับ Drift แบบ Univariate

การติดตามตรวจสอบ Machine Learning ด้วย Python

Hakim Elakhrass

CEO and co-founder

Univariate Drift Detection คืออะไร?
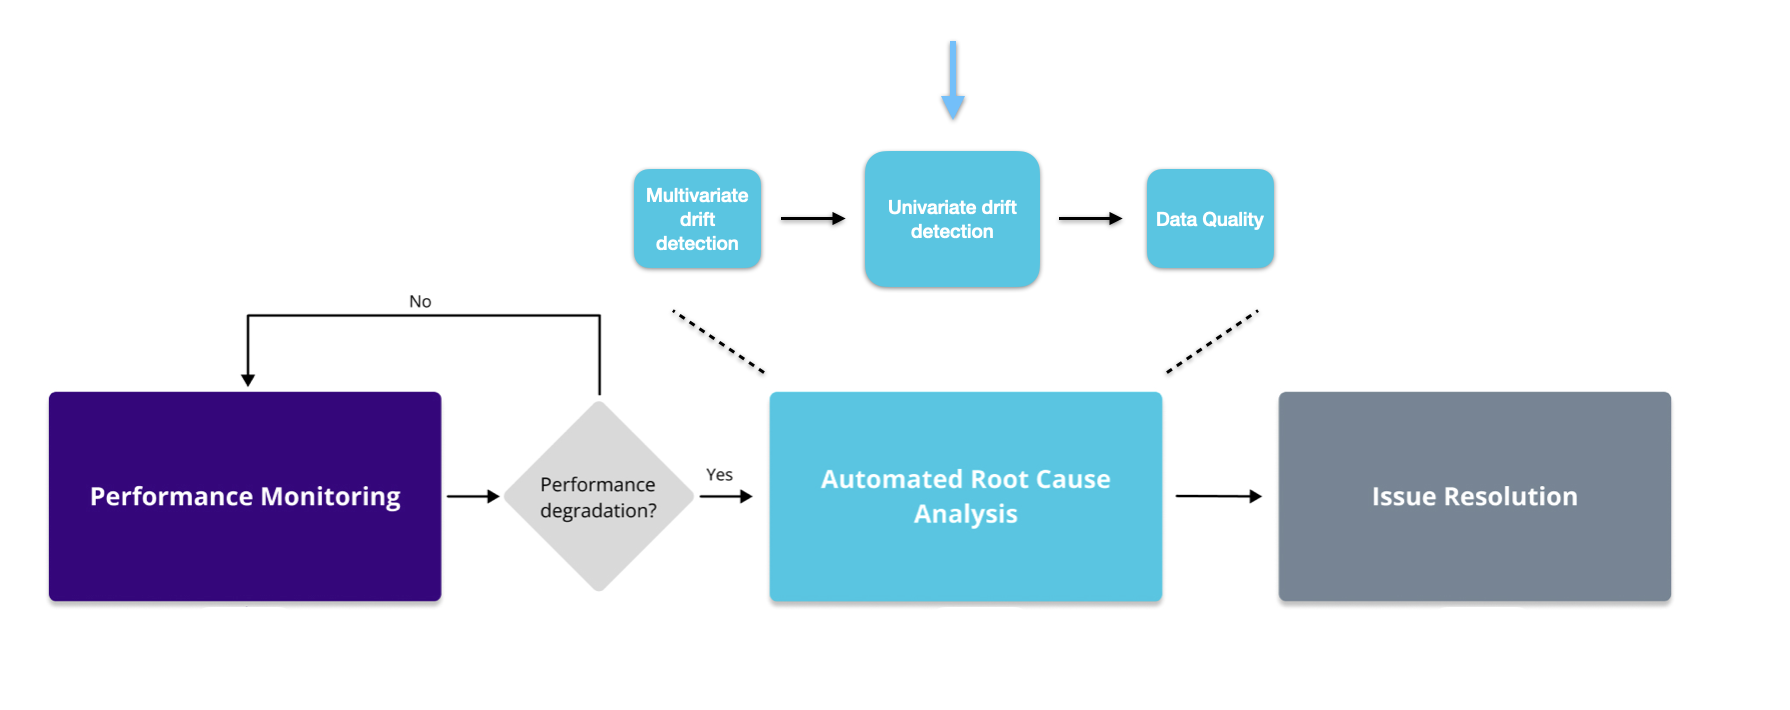
ภาพแสดงขั้นตอนการ Monitoring และตำแหน่งของวิธี Univariate ในกระบวนการ

การติดตามตรวจสอบ Machine Learning ด้วย Python

วิธี Univariate

  • Jensen-Shannen distance — ทั้ง Categorical และ Continuous
  • Hellinger — ทั้ง Categorical และ Continuous
  • Wasserstein — เฉพาะ Continuous
  • Kolgomorov-Smirnov — เฉพาะ Continuous

  • L-infinity — เฉพาะ Categorical

  • Chi2 — เฉพาะ Categorical

1 https://nannyml.readthedocs.io/en/stable/how_it_works/univariate_drift_comparison.html
การติดตามตรวจสอบ Machine Learning ด้วย Python

การเขียนโค้ด

# Intialize the univariate drift calculator
uv_calc = nannyml.UnivariateDriftCalculator(
    continuous_methods=['wasserstein', 'hellinger'],
    categorical_methods=['jensen_shannon', 'l_infinity', 'chi2'],
    column_names=feature_column_names,
    timestamp_column_name='timestamp',
    chunk_period='d'
    )
# Fit, calculate and plot the results
uv_calc.fit(reference)
uv_results = uv_calc.calculate(analysis)
uv_results.plot().show()
การติดตามตรวจสอบ Machine Learning ด้วย Python

การกรองผลลัพธ์

  • ตามชื่อคอลัมน์
  • ตามวิธี Univariate
# Filter the univariate results
filtered_figure = uv_results.filter(column_names=['trip_distance', 'fare_amount'], 
            methods=['jensen_shannon'])

# Plot the filtered results
filtered_figure.show().plot()
การติดตามตรวจสอบ Machine Learning ด้วย Python

Alert Count Ranker

  • จัดอันดับ Feature ตามจำนวน Alert
# Initialize the alert count ranker
alert_count_ranker = nannyml.AlertCountRanker()
alert_count_ranked_results = alert_count_ranker.rank(
    uv_results,
    only_drifting=False)
# Display the results
display(alert_count_ranked_results)
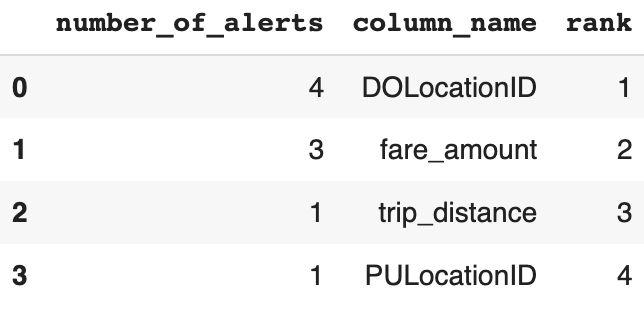
ภาพแสดง DataFrame ที่มีข้อมูลจำนวน Alert ของแต่ละ Feature

การติดตามตรวจสอบ Machine Learning ด้วย Python

Correlation Ranker

  • จัดอันดับ Feature ตามความสัมพันธ์กับการเปลี่ยนแปลงของ Performance
# Initialize the correlation ranker
correlation_ranker = nannyml.CorrelationRanker()
correlation_ranker.fit(perf_results.filter(period='reference'))
correlation_ranked_results = correlation_ranker.rank(uv_results, perf_results)

# Display the results
display(correlation_ranked_results)
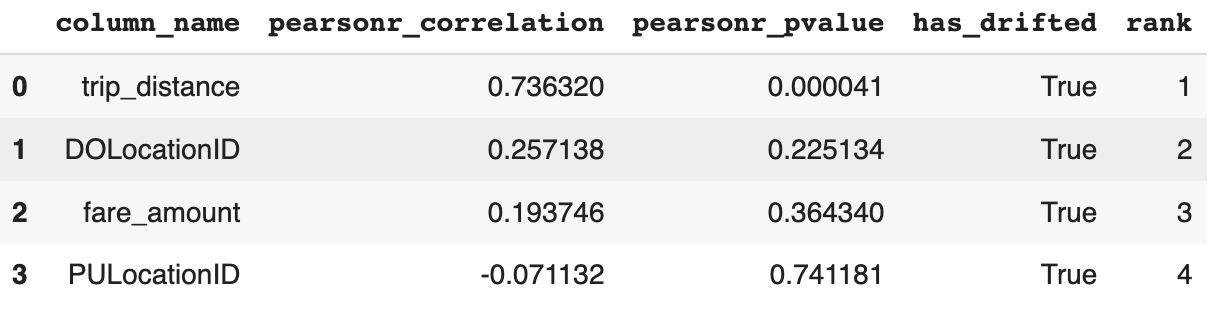
ภาพแสดง DataFrame ที่มีค่า Pearson Correlation และ P-value ของแต่ละ Feature

การติดตามตรวจสอบ Machine Learning ด้วย Python

การ Monitor การกระจายตัวของ Feature

  • ให้ข้อมูลเชิงลึกและเพิ่มความสามารถในการอธิบายโมเดล
# Create distribution plots
distribution_results = uv_results.plot(kind='distribution')

# Show the plots
distribution_results.show()
การติดตามตรวจสอบ Machine Learning ด้วย Python

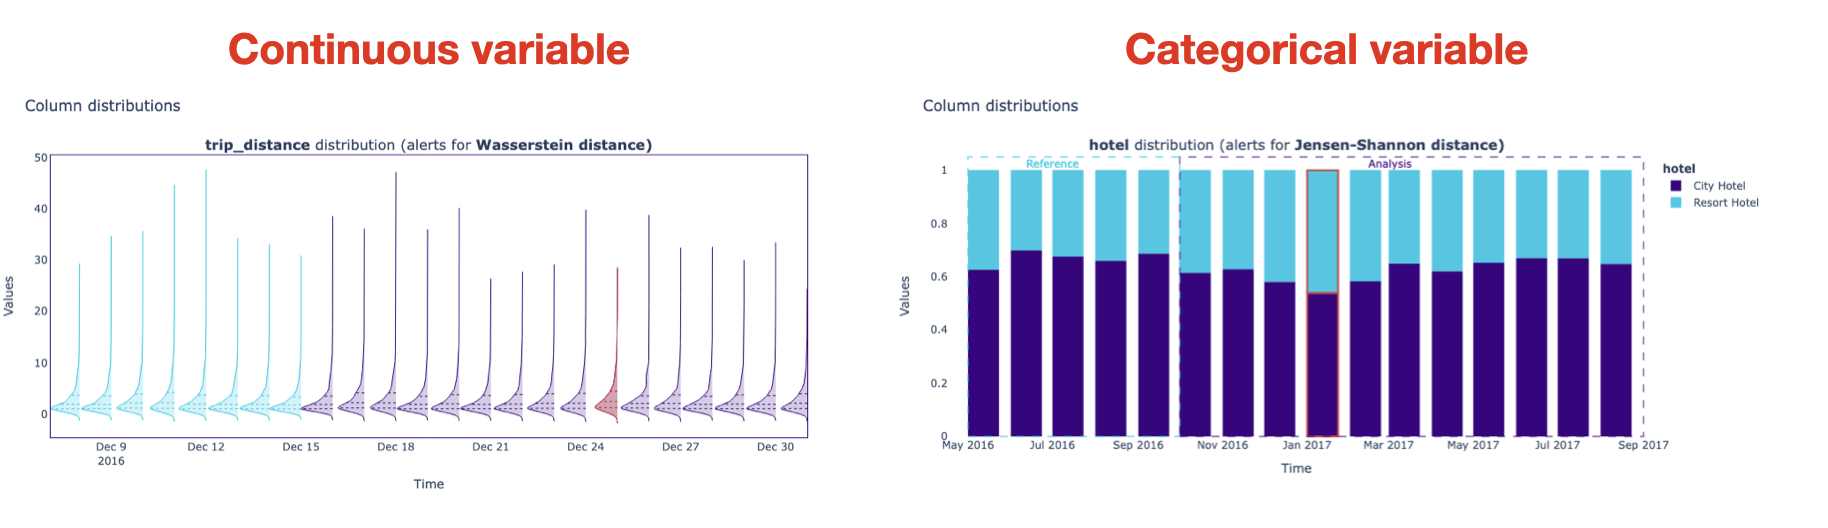
กราฟการกระจายตัวของ Feature


ภาพแสดงกราฟการกระจายตัวของ Feature แบบ Continuous และ Categorical

การติดตามตรวจสอบ Machine Learning ด้วย Python

มาฝึกกันเถอะ!

การติดตามตรวจสอบ Machine Learning ด้วย Python

Preparing Video For Download...