Як візуалізувати дані в Python?

Практика співбесід із програмування на Python

Kirill Smirnov

Data Science Consultant, Altran

matplotlib

import matplotlib.pyplot as plt
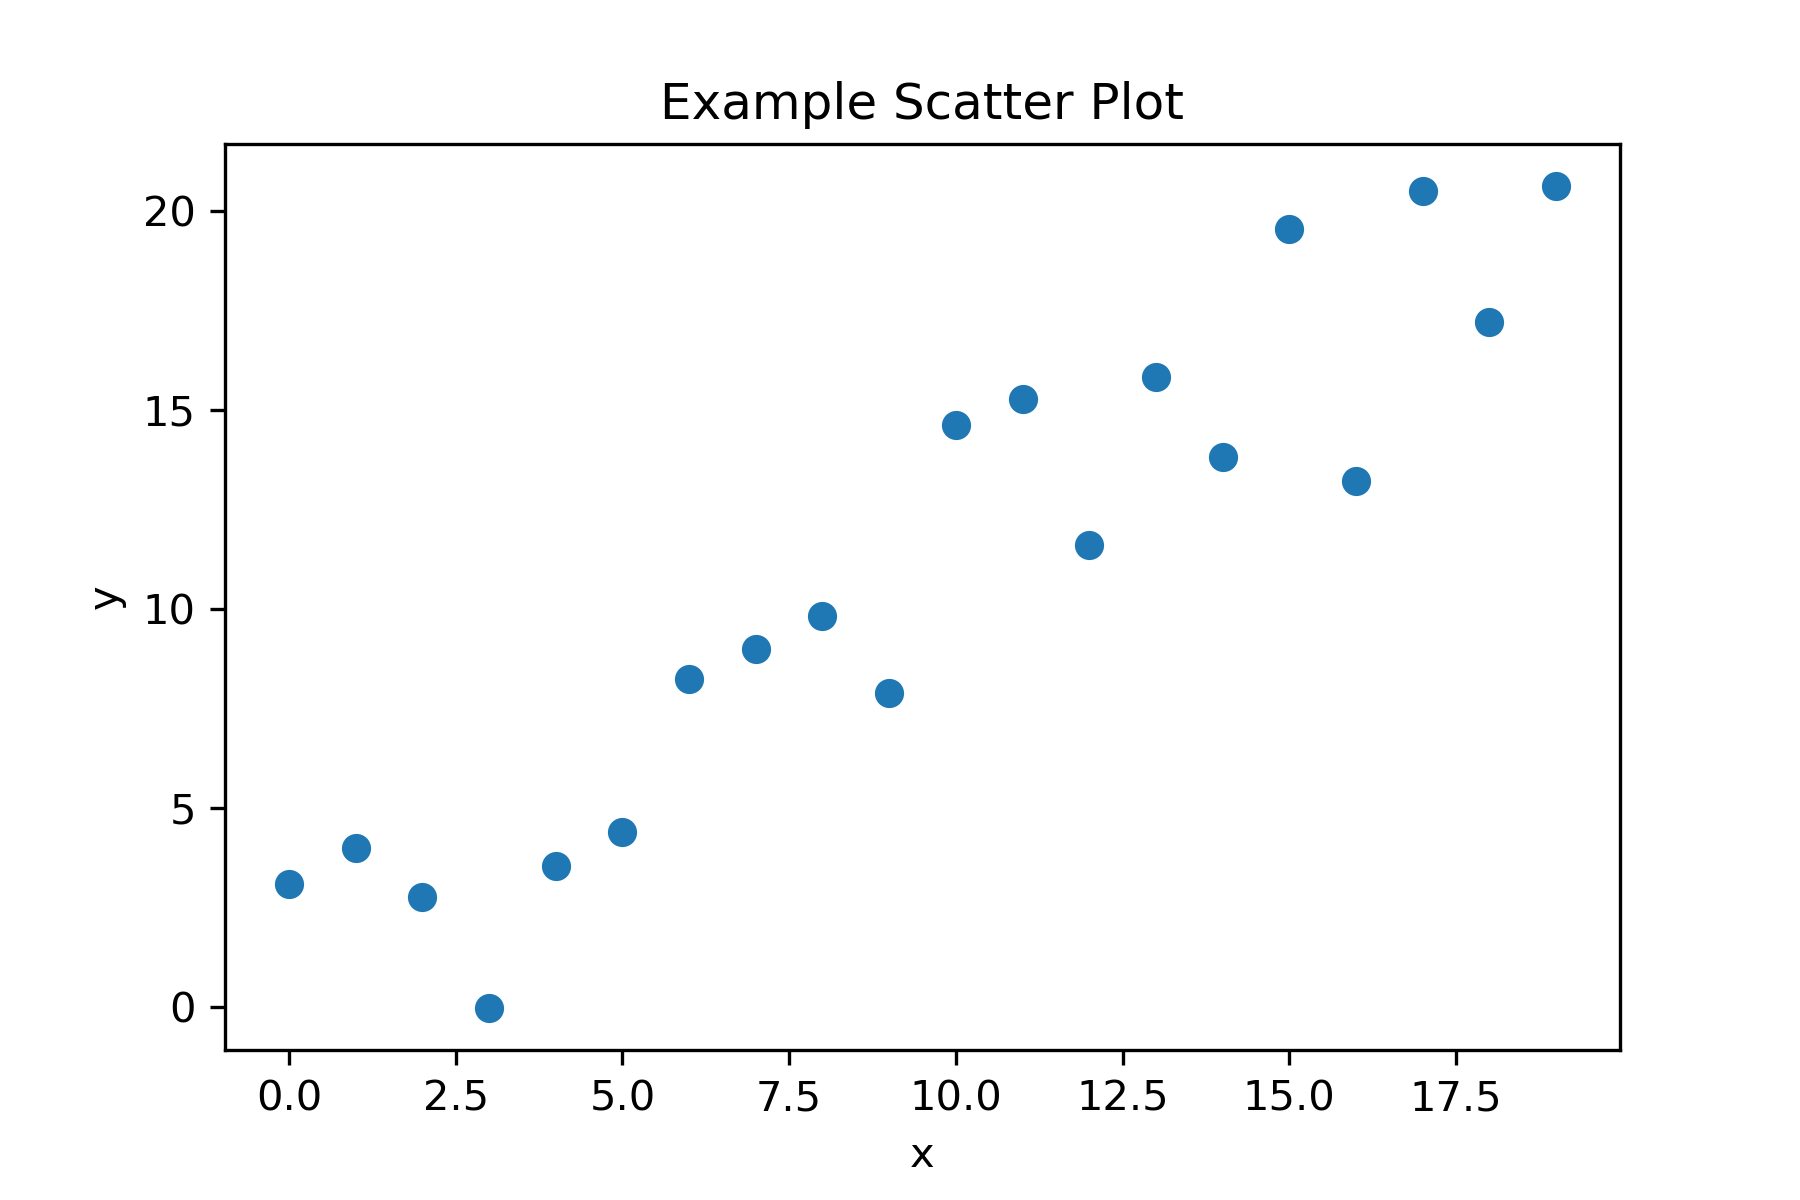
  • точкова діаграма
  • гістограма
  • ящик з вусами
Практика співбесід із програмування на Python

Набір даних

import pandas as pd

diabetes = pd.read_csv('diabetes.csv')
diabetes = diabetes[[
    'n pregnant', 'plasma glucose', 'blood pressure', 'skin thickness',
    'serum insulin', 'bmi', 'age', 'test result']]
print(diabetes.head())
   n pregnant  plasma glucose  blood pressure  skin thickness  serum insulin   bmi  age test result
0           6           148.0            72.0            35.0            NaN  33.6   50    positive
1           1            85.0            66.0            29.0            NaN  26.6   31    negative
2           8           183.0            64.0             NaN            NaN  23.3   32    positive
3           1            89.0            66.0            23.0           94.0  28.1   21    negative
4           0           137.0            40.0            35.0          168.0  43.1   33    positive
Практика співбесід із програмування на Python

Точкова діаграма

Точкова діаграма

Практика співбесід із програмування на Python

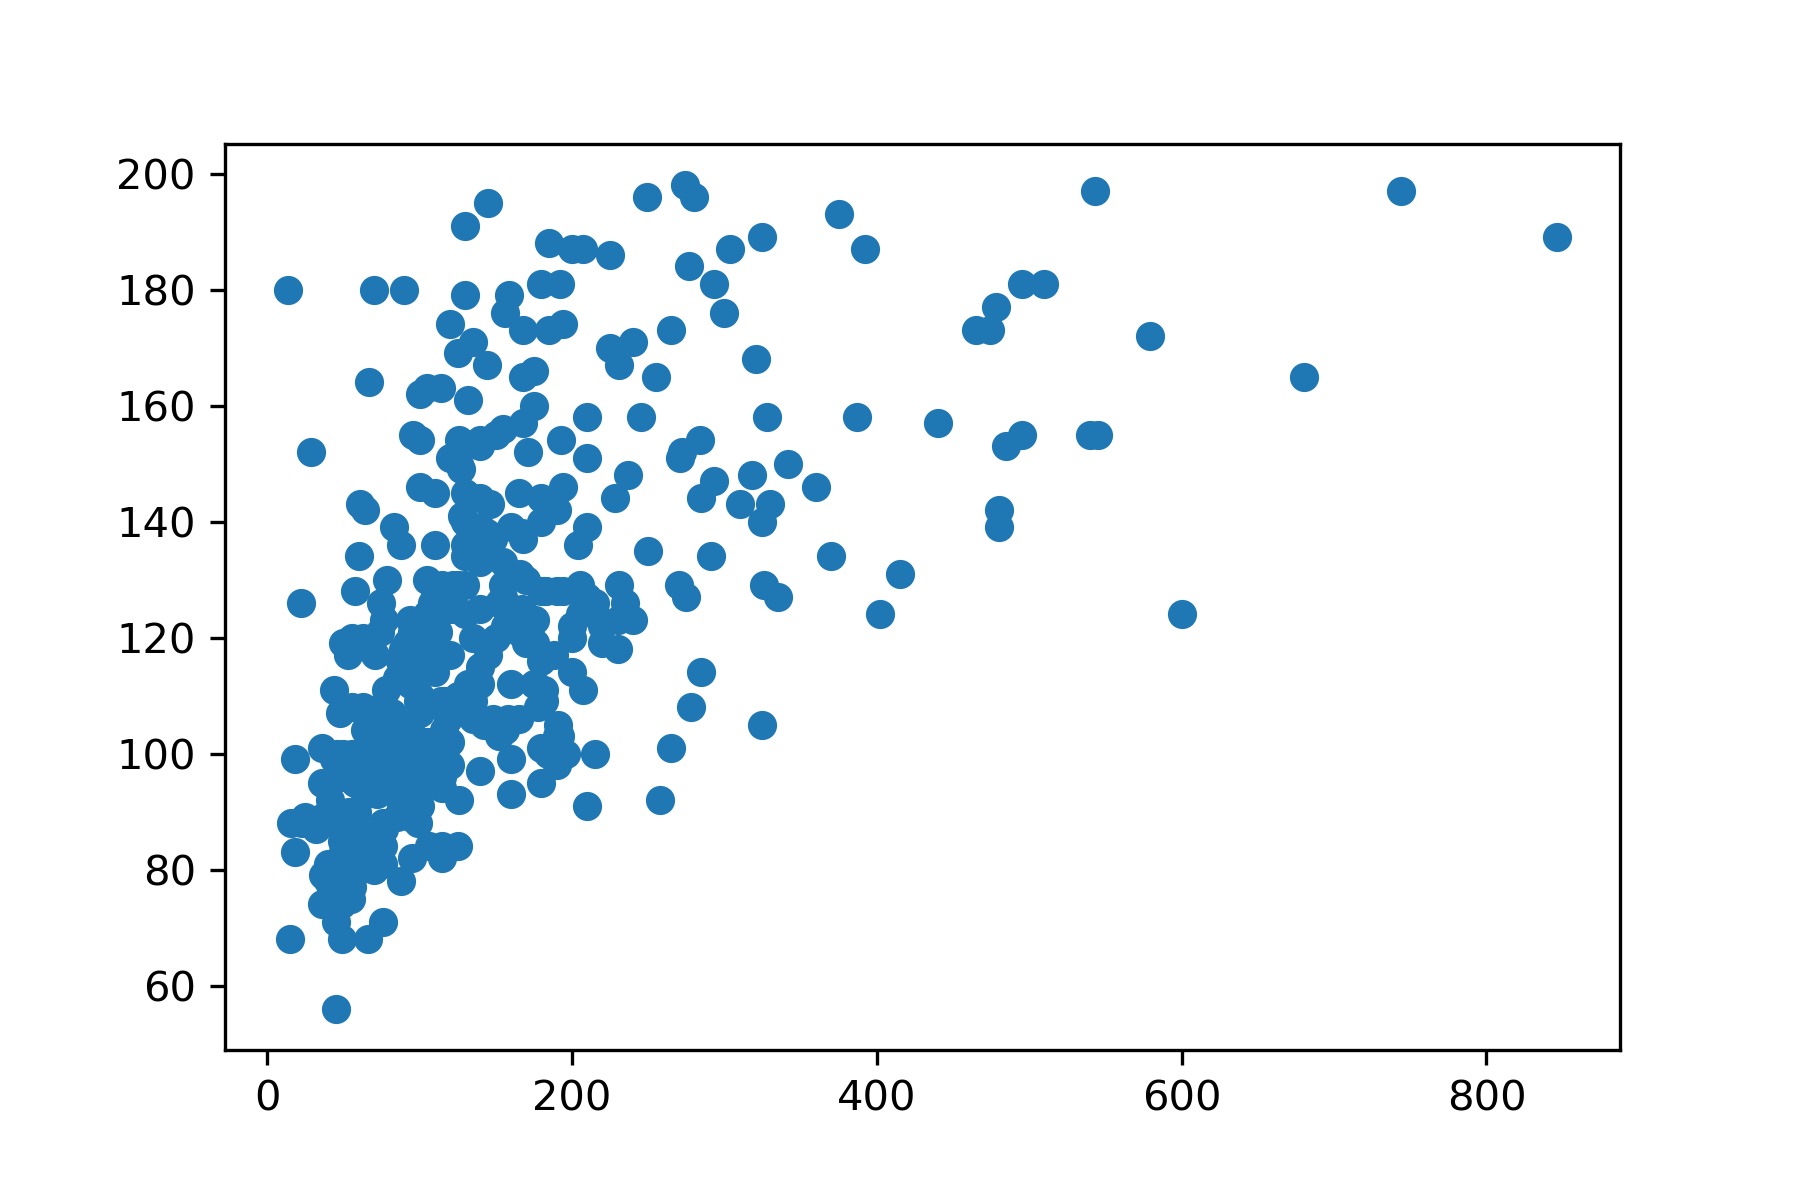
Створіть точкову діаграму

import matplotlib.pyplot as plt
plt.scatter(
    diabetes['serum insulin'],
    diabetes['plasma glucose']
)
plt.show()

Точкова діаграма

Практика співбесід із програмування на Python

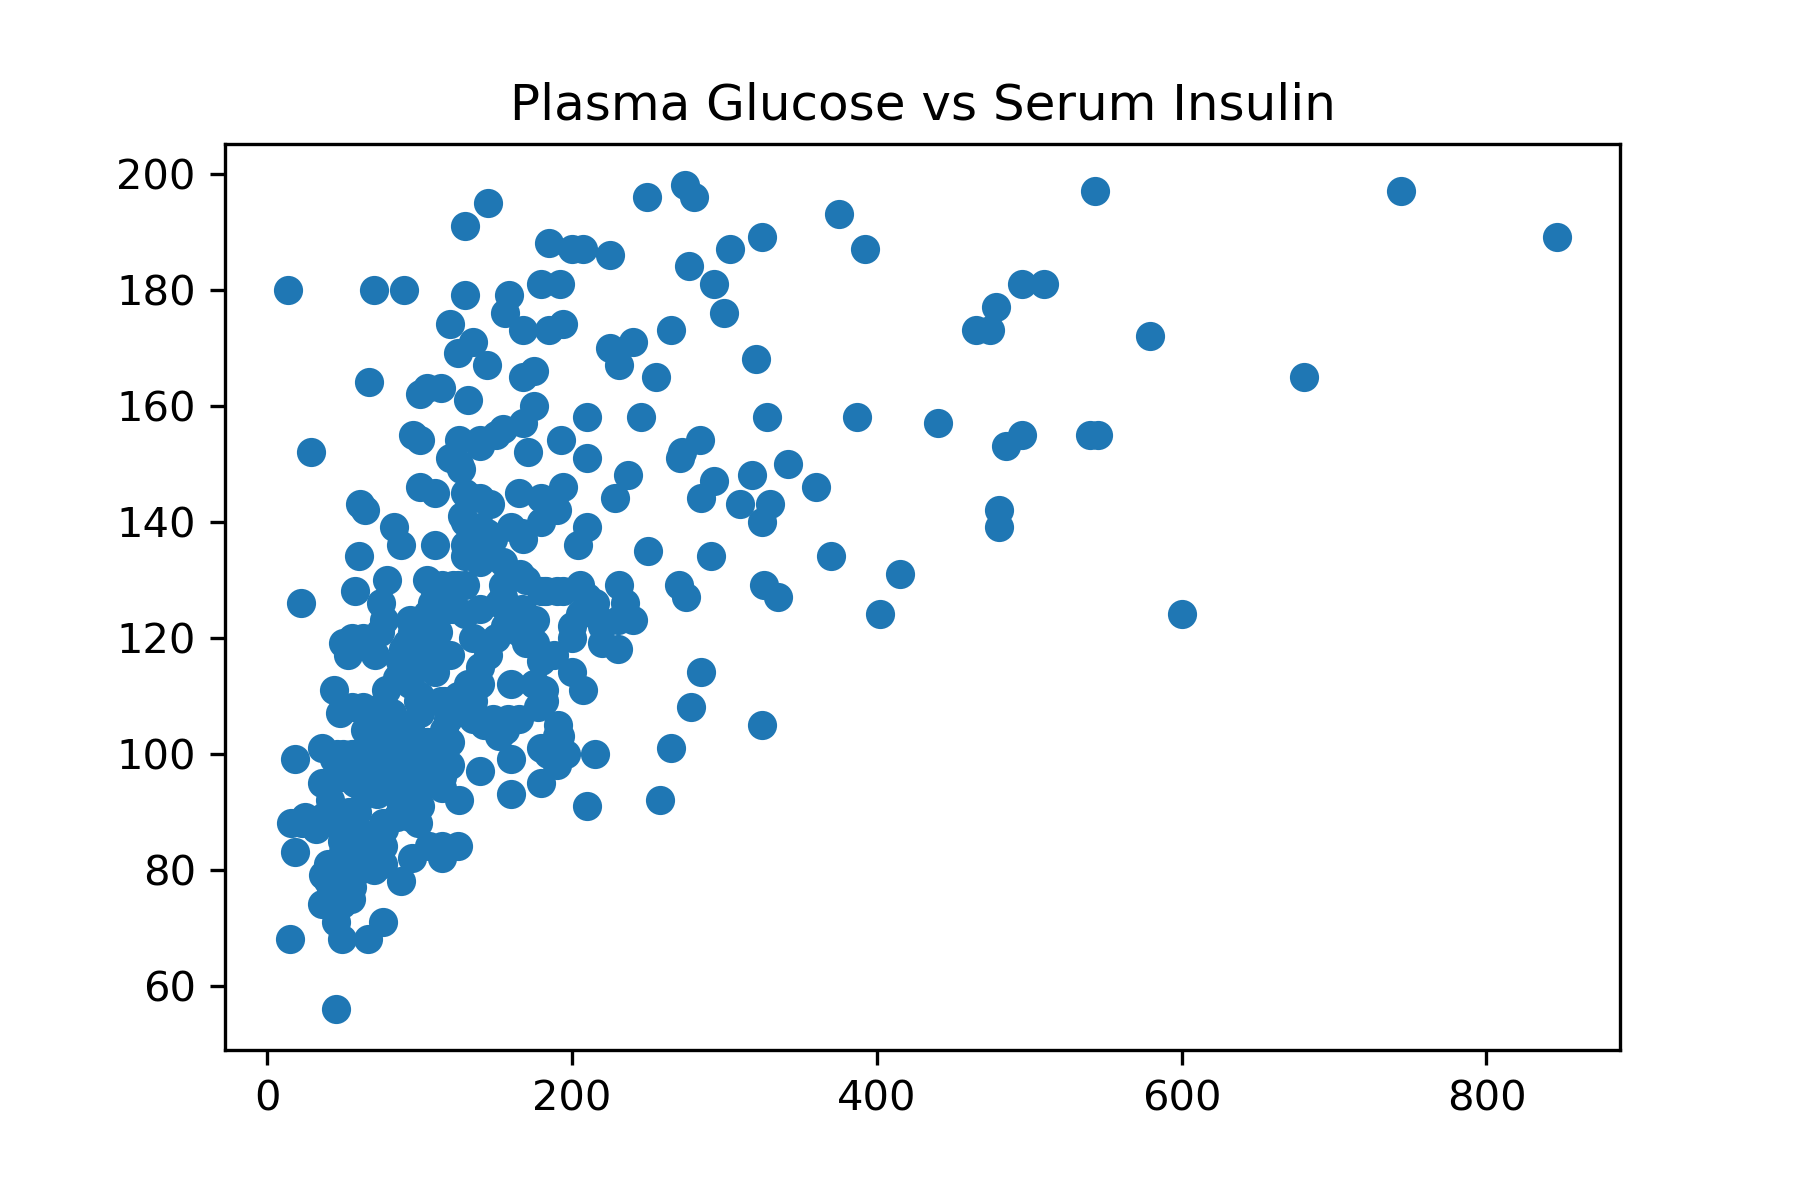
Створіть точкову діаграму

import matplotlib.pyplot as plt
plt.scatter(
    diabetes['serum insulin'],
    diabetes['plasma glucose']
)

plt.title('Plasma Glucose vs Serum Insulin')

plt.show()

Точкова діаграма

Практика співбесід із програмування на Python

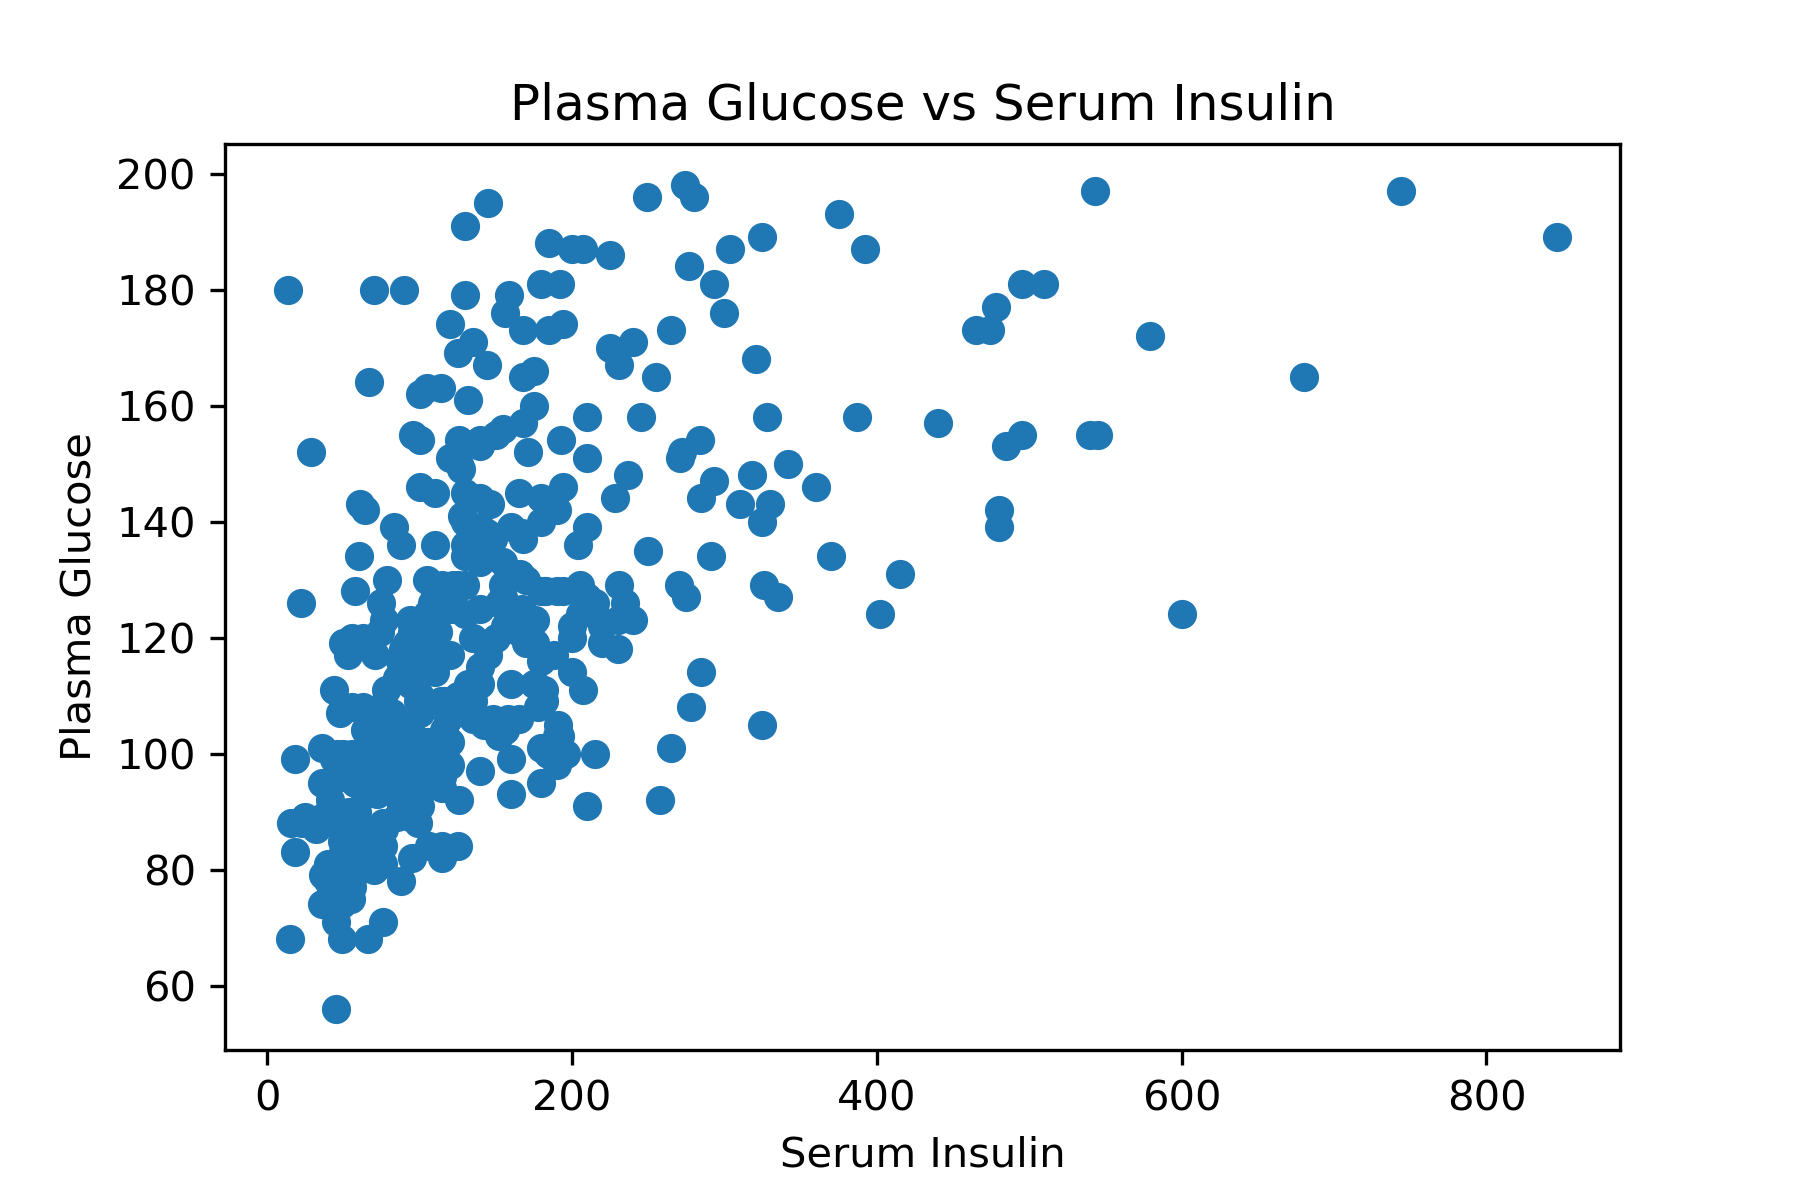
Створіть точкову діаграму

import matplotlib.pyplot as plt
plt.scatter(
    diabetes['serum insulin'],
    diabetes['plasma glucose']
)

plt.title('Plasma Glucose vs Serum Insulin')

plt.xlabel('Serum Insulin')
plt.ylabel('Plasma Glucose')

plt.show()

Точкова діаграма

Практика співбесід із програмування на Python

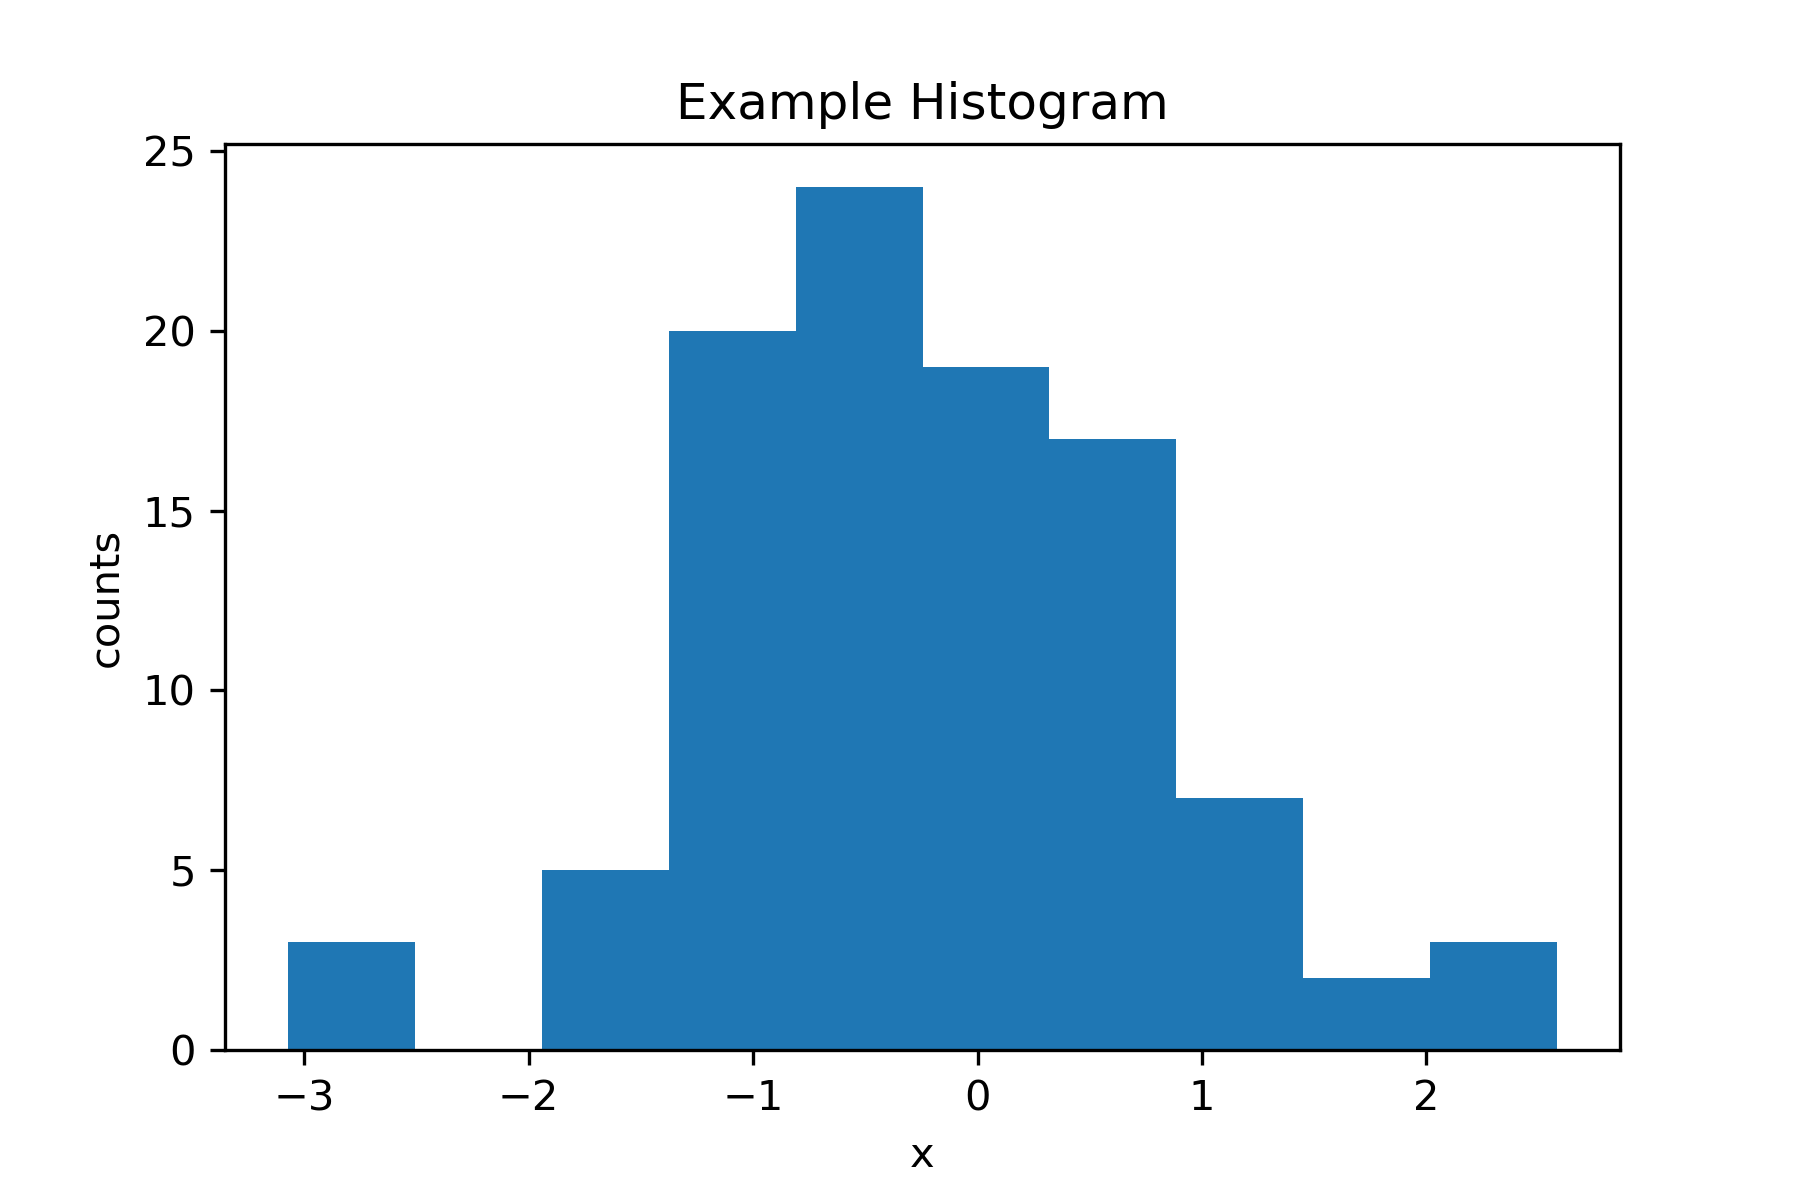
Гістограма

Гістограма

Практика співбесід із програмування на Python

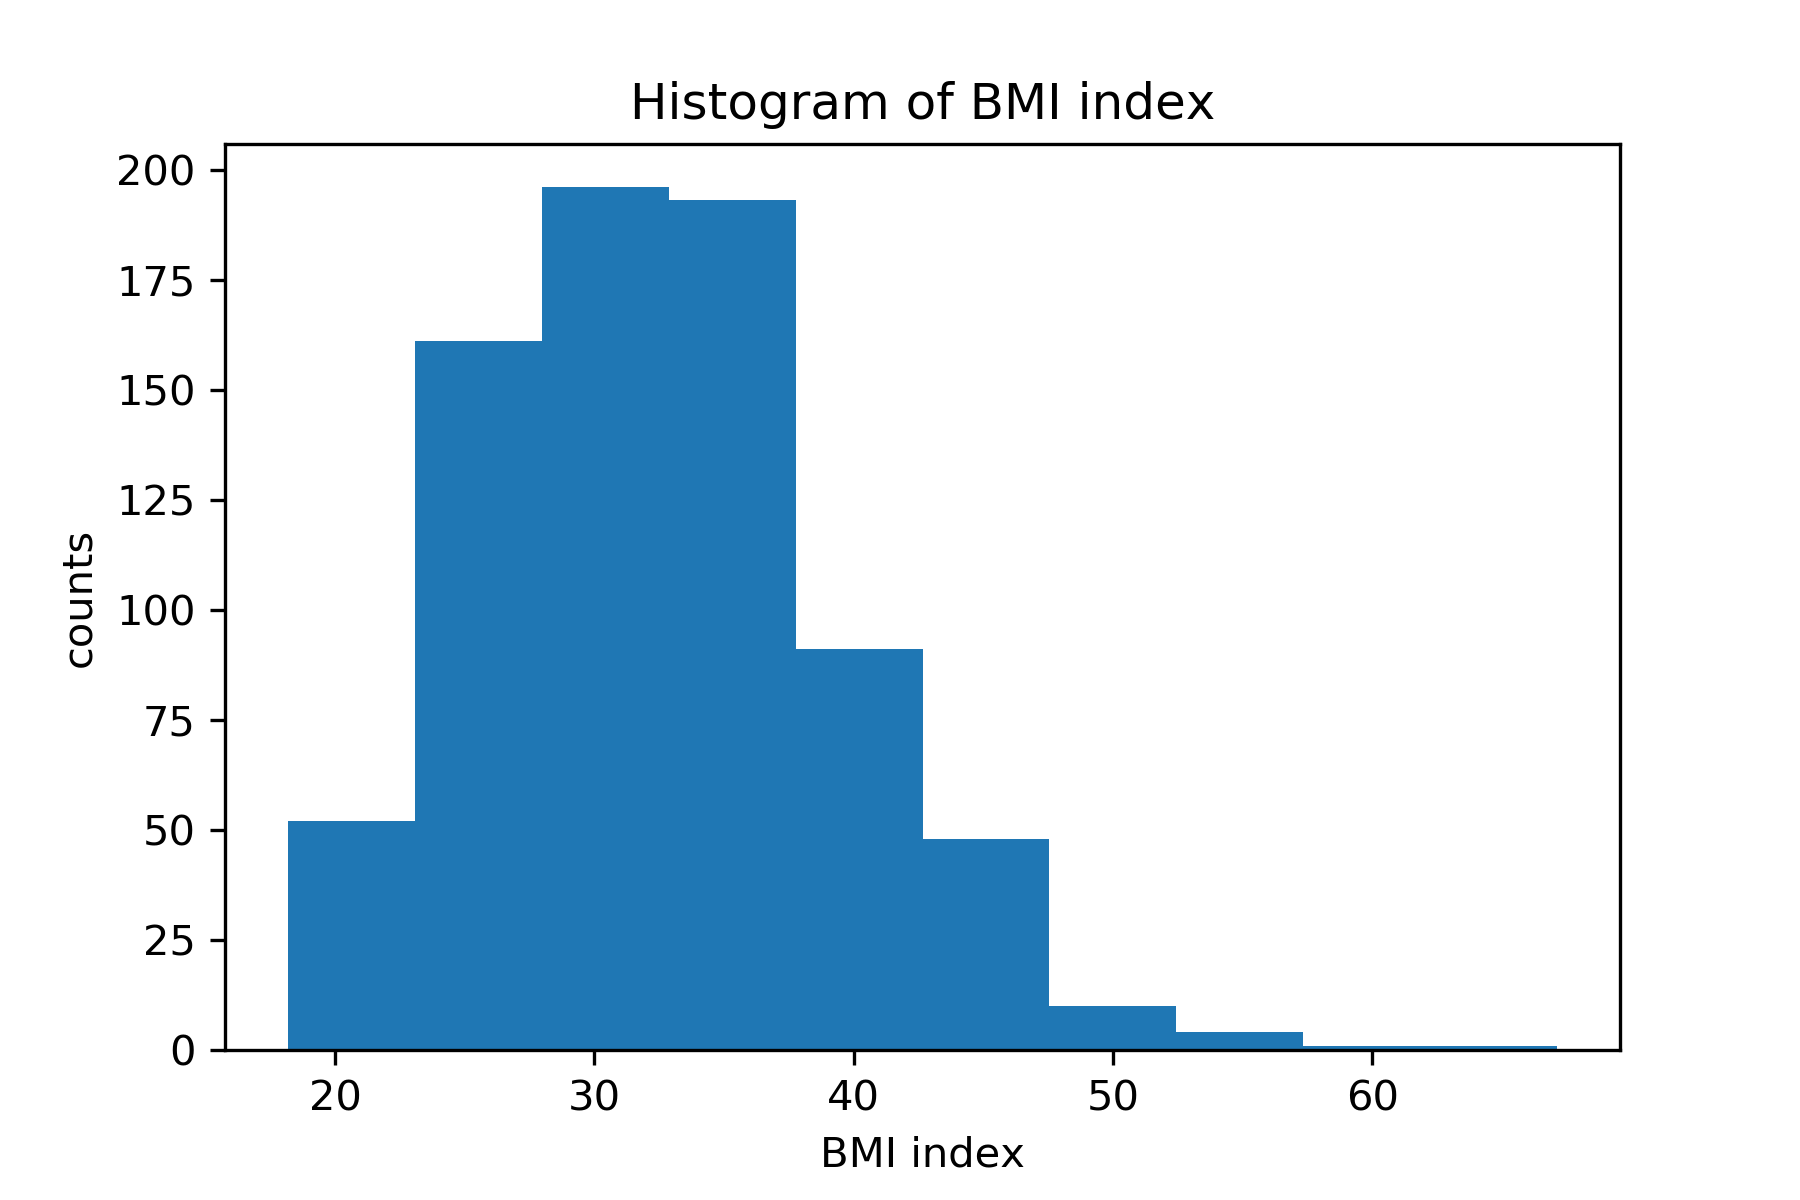
Створіть гістограму

import matplotlib.pyplot as plt
plt.hist(diabetes['bmi'])

plt.title('Histogram of BMI index')

plt.xlabel('BMI index')
plt.ylabel('counts')

plt.show()

Гістограма

Практика співбесід із програмування на Python

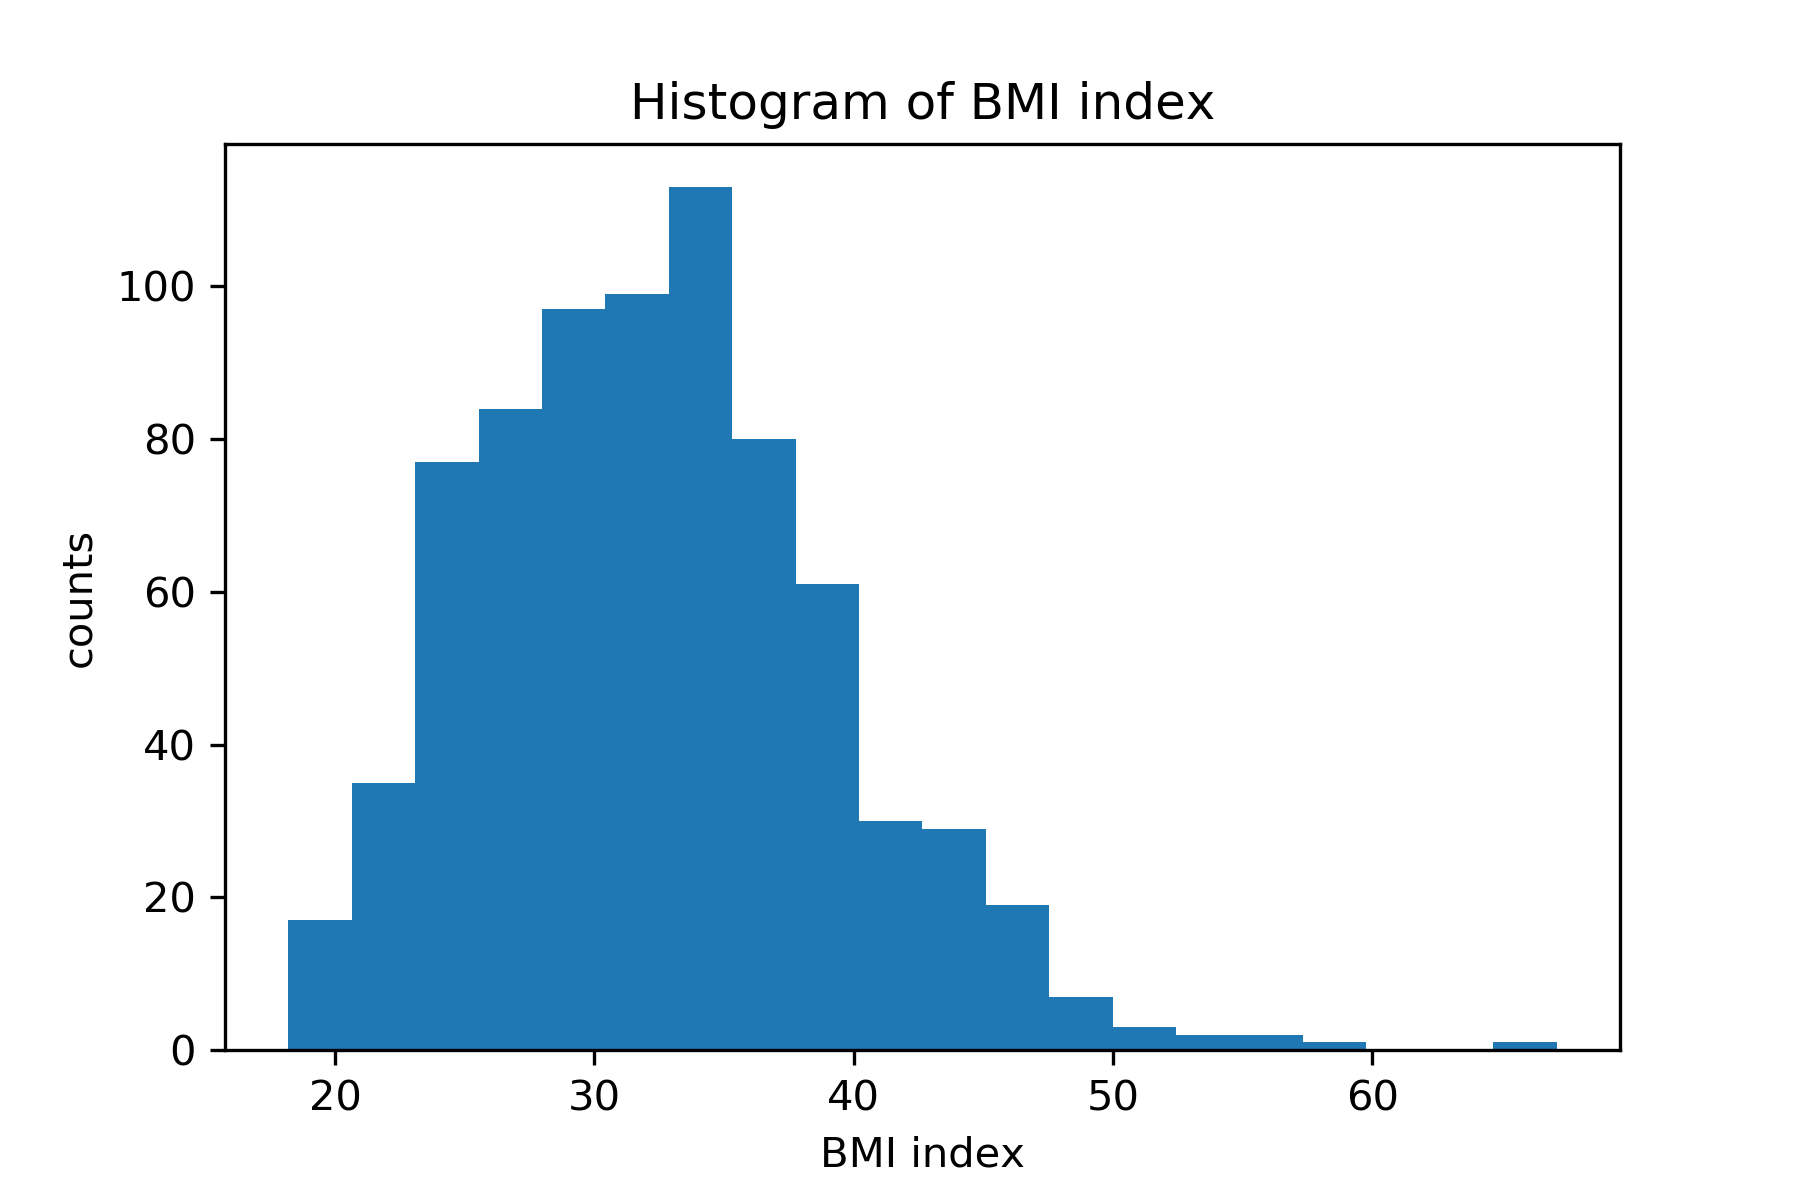
Створіть гістограму

import matplotlib.pyplot as plt
plt.hist(diabetes['bmi'], bins=20)

plt.title('Histogram of BMI index')

plt.xlabel('BMI index')
plt.ylabel('counts')

plt.show()

Гістограма

Практика співбесід із програмування на Python

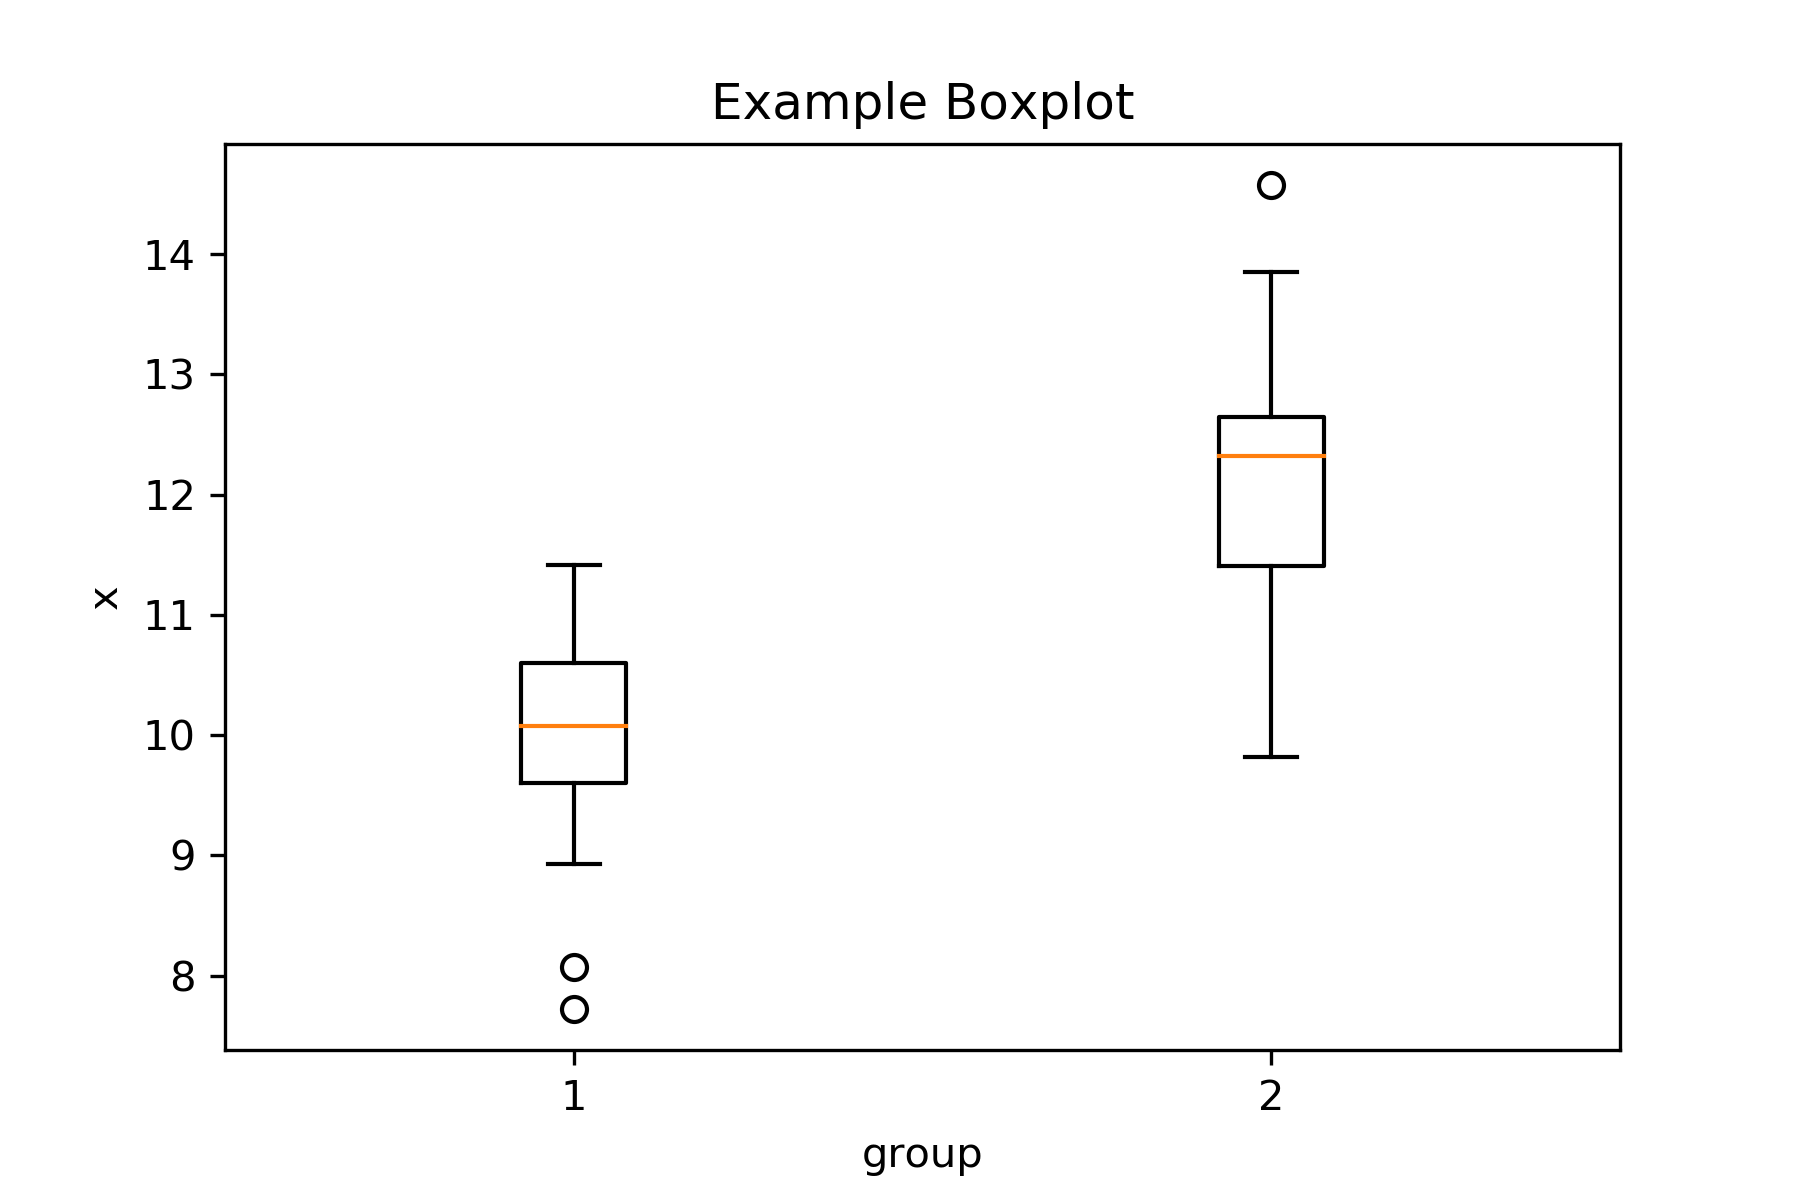
Ящик з вусами

Ящик з вусами

Практика співбесід із програмування на Python

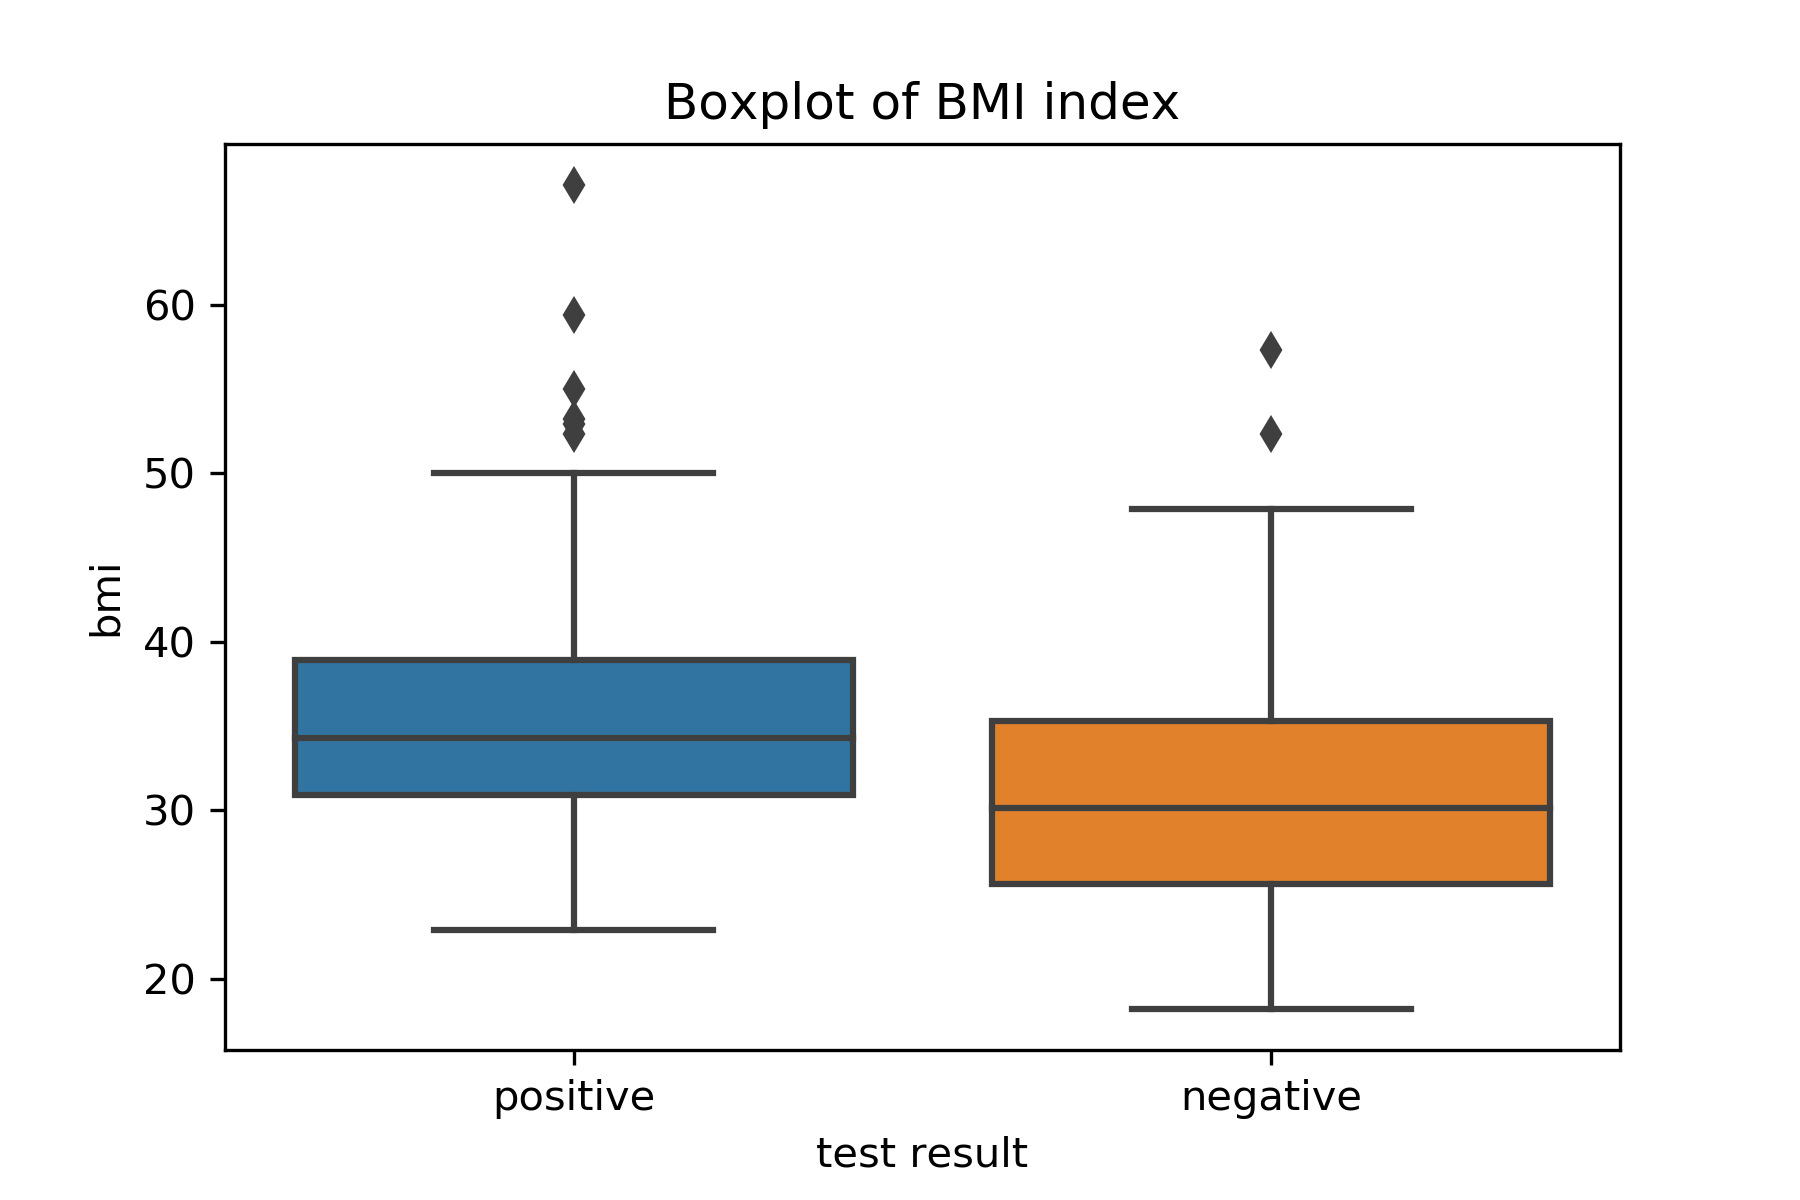
Створіть «ящик з вусами»

import seaborn as sns
sns.boxplot('test_result', 'bmi', data=diabetes)
plt.title('Boxplot of BMI index')

plt.show()

Ящик з вусами

Практика співбесід із програмування на Python

Створіть «ящик з вусами»

import seaborn as sns
sns.boxplot(
    x='test_result',
    y='bmi',
    data=diabetes
)
plt.title('Boxplot of BMI index')

plt.show()

Ящик з вусами

Практика співбесід із програмування на Python

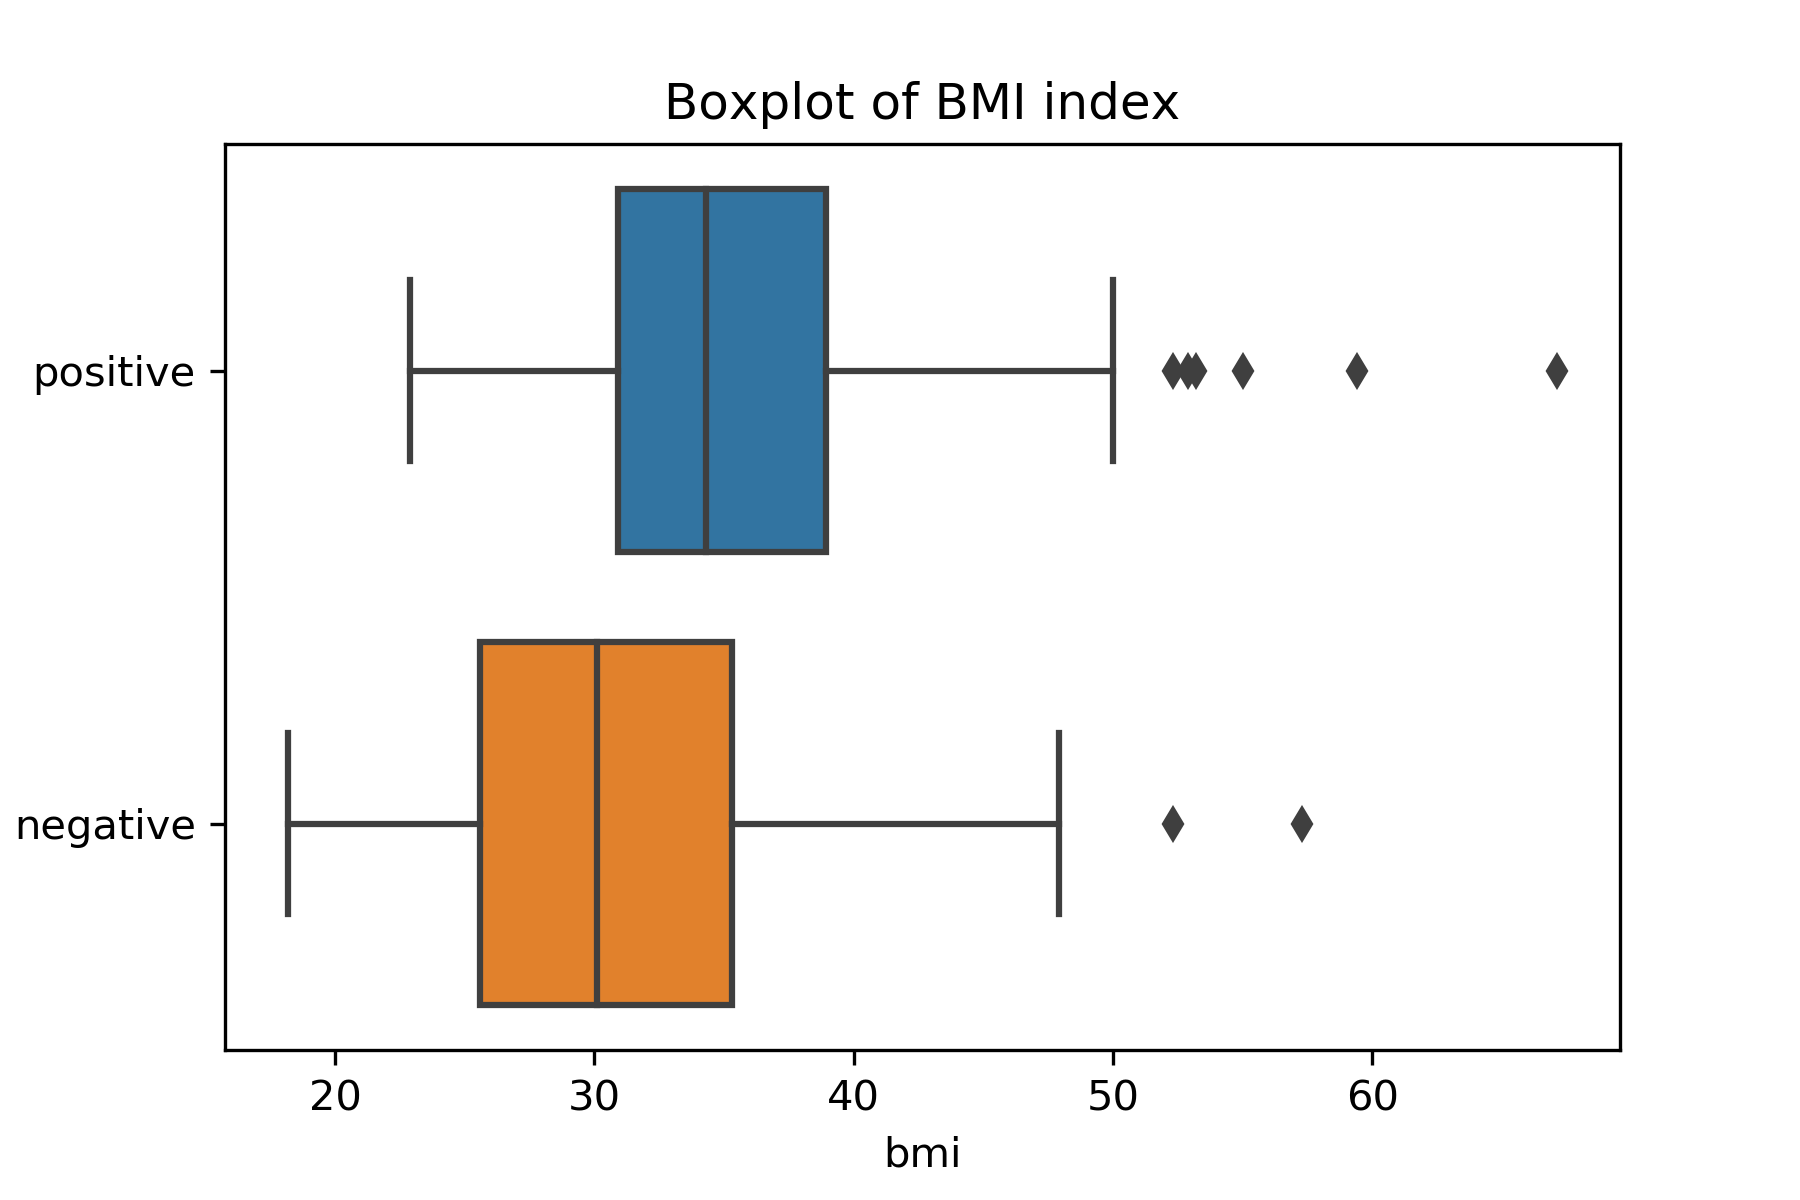
Створіть «ящик з вусами»

import seaborn as sns
sns.boxplot(
    y='test_result',
    x='bmi',
    data=diabetes
)
plt.title('Boxplot of BMI index')

plt.show()

Ящик з вусами

Практика співбесід із програмування на Python

Давайте потренуємось!

Практика співбесід із програмування на Python

Preparing Video For Download...