Parts of a regression
Hierarchical and Mixed Effects Models in R

Richard Erickson
Data Scientist
An intercept
$y = \beta + \epsilon$
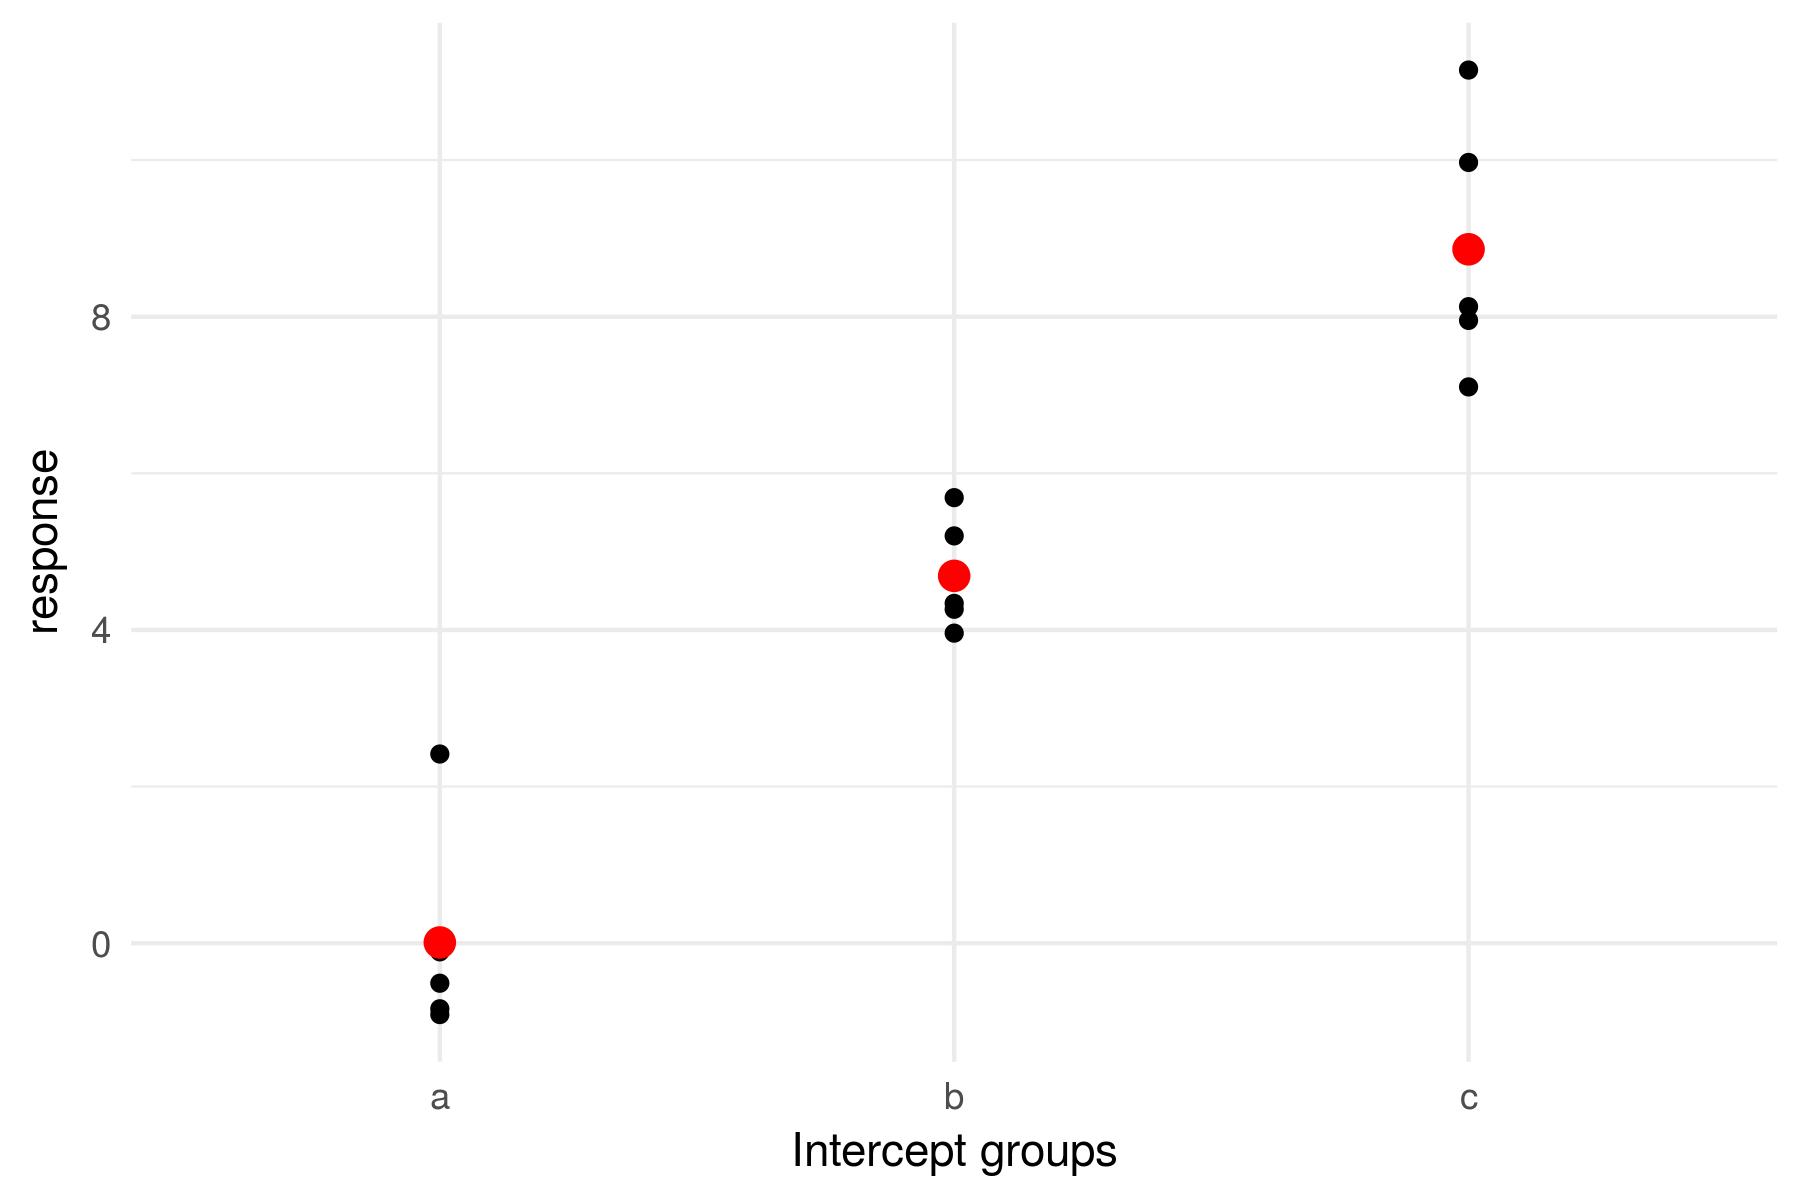
Multiple intercepts
$y = \beta_0 + \beta_2 x_2+ \beta_3 x_3+ \epsilon$
$y = \beta_1 x_1 + \beta_2 x_2+ \beta_3 x_3+ \epsilon$

Linear models in R
lm(formula, data)
lm(y ~ x, data = myData)
anova(lm(y ~ x, data = myData))
A simple linear regression with slopes
$y \sim \beta_0 + \beta_1 x + \epsilon$
Multiple regression
\(y \sim \beta_0 + \beta_1 x_1 + \beta_2 x_2 + \ldots + \epsilon\)
Multiple regression caveats
- Independence of predictor variables
- "corrected for..."
- Simpson's paradox
- Only linear
- Interactions may be important
Multiple regression in R tips
lm(y ~ x - 1)estimates an intercept for each x- Numeric versus factors
- Scaling parameters and slopes
lm(y ~ x1 + x2 + x1:x2)can be written aslm(y ~ x1 * x2)
Refresher of running and plotting a linear regression in R
reg_model <- lm(response ~ predictor, data = reg_demo)summary(reg_model) reg_model reg_coef_plot <- tidy(reg_model)ggplot(reg_model, aes(x = predictor, y = response)) + geom_point() + theme_minimal() + geom_abline(intercept = reg_model$estimate[1], slope = reg_model$estimate[2])
Let's practice!
Hierarchical and Mixed Effects Models in R

