Utforska och visualisera rumsliga data och deras attribut

Arbeta med geospatial data i Python

Joris Van den Bossche

Open source software developer and teacher, GeoPandas maintainer

Filtrera data

countries.head()
          name      continent       gdp                            geometry
0  Afghanistan           Asia   64080.0  POLYGON ((61.21 35.65, 62.23 35...
1       Angola         Africa  189000.0  MULTIPOLYGON (((23.90 -11.72, 2...
...
countries['continent'] == 'Africa'
0      False
1       True
         ...  
175     True
176     True
Name: continent, Length: 177, dtype: bool
Arbeta med geospatial data i Python

Filtrera data

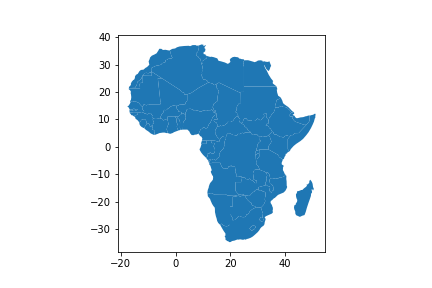
countries_africa = countries[countries['continent'] == 'Africa']
countries_africa.plot()
Arbeta med geospatial data i Python

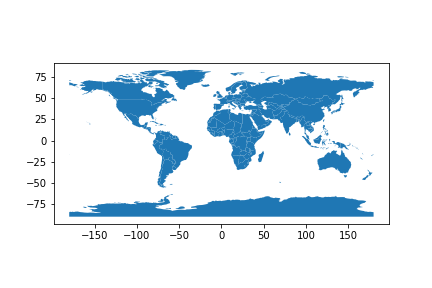
Visualisera rumsliga data

countries.plot()
Arbeta med geospatial data i Python

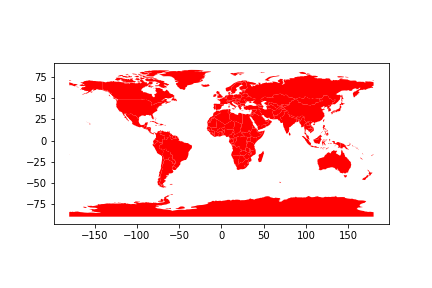
Justera färg: enhetlig färg

countries.plot(color="red")
Arbeta med geospatial data i Python

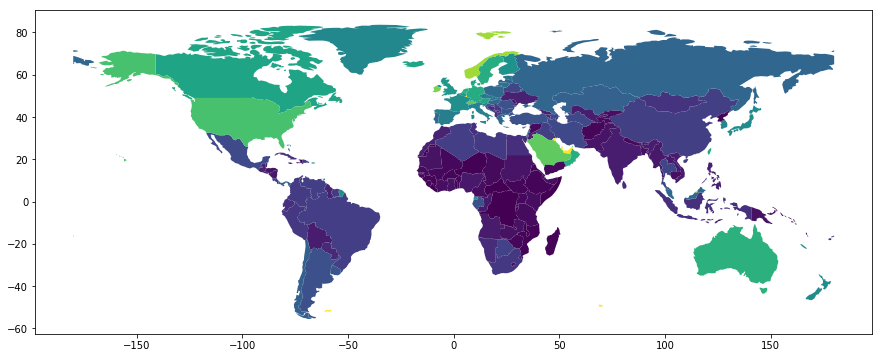
Justera färg: baserat på attributvärden

countries.plot(column='gdp_per_cap')
Arbeta med geospatial data i Python

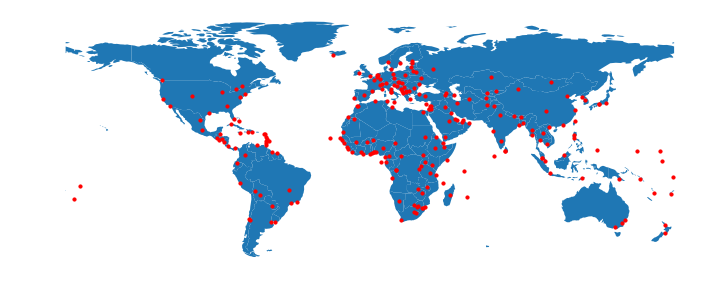
Flerlagerplot

fig, ax = plt.subplots(figsize=(12, 6))
countries.plot(ax=ax)
cities.plot(ax=ax, color='red', markersize=10)
ax.set_axis_off()
Arbeta med geospatial data i Python

Nu kör vi en övning!

Arbeta med geospatial data i Python

Preparing Video For Download...