การสำรวจและแสดงภาพข้อมูลเชิงพื้นที่และแอตทริบิวต์

การทำงานกับข้อมูลเชิงพื้นที่ใน Python

Joris Van den Bossche

Open source software developer and teacher, GeoPandas maintainer

การกรองข้อมูล

countries.head()
          name      continent       gdp                            geometry
0  Afghanistan           Asia   64080.0  POLYGON ((61.21 35.65, 62.23 35...
1       Angola         Africa  189000.0  MULTIPOLYGON (((23.90 -11.72, 2...
...
countries['continent'] == 'Africa'
0      False
1       True
         ...  
175     True
176     True
Name: continent, Length: 177, dtype: bool
การทำงานกับข้อมูลเชิงพื้นที่ใน Python

การกรองข้อมูล

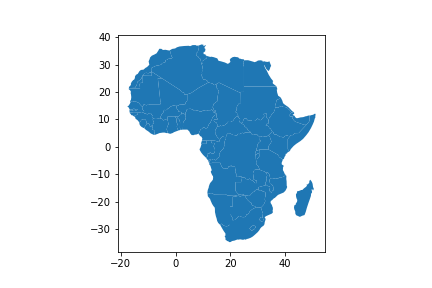
countries_africa = countries[countries['continent'] == 'Africa']
countries_africa.plot()
การทำงานกับข้อมูลเชิงพื้นที่ใน Python

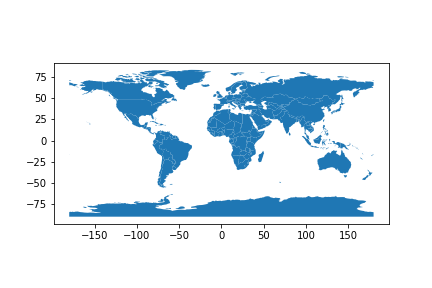
การแสดงภาพข้อมูลเชิงพื้นที่

countries.plot()
การทำงานกับข้อมูลเชิงพื้นที่ใน Python

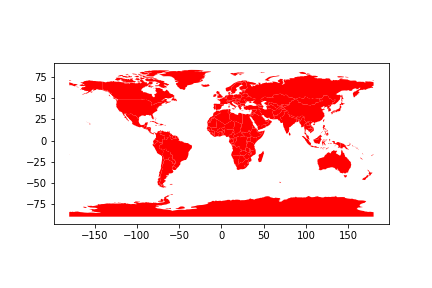
ปรับสี: ใช้สีเดียวกันทั้งหมด

countries.plot(color="red")
การทำงานกับข้อมูลเชิงพื้นที่ใน Python

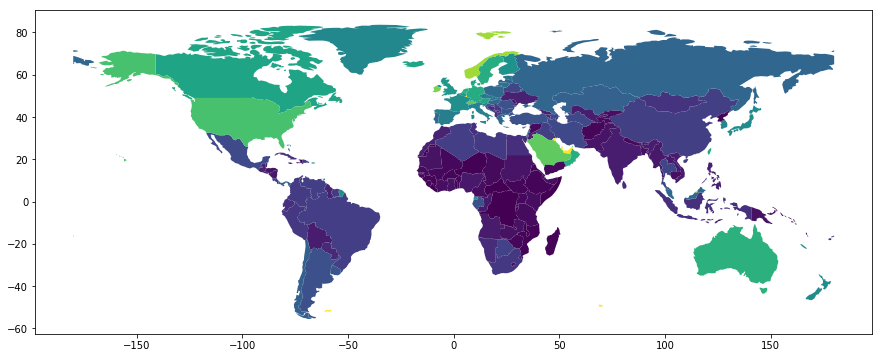
ปรับสี: ตามค่าแอตทริบิวต์

countries.plot(column='gdp_per_cap')
การทำงานกับข้อมูลเชิงพื้นที่ใน Python

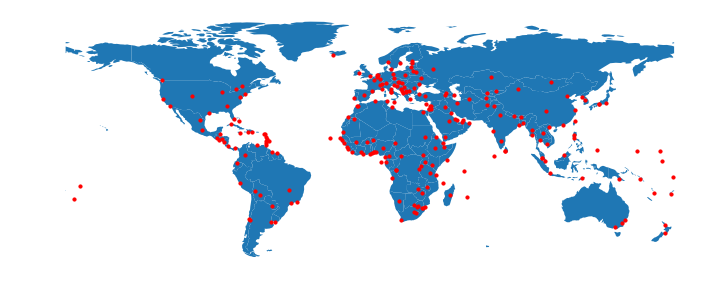
การพล็อตหลายเลเยอร์

fig, ax = plt.subplots(figsize=(12, 6))
countries.plot(ax=ax)
cities.plot(ax=ax, color='red', markersize=10)
ax.set_axis_off()
การทำงานกับข้อมูลเชิงพื้นที่ใน Python

มาฝึกกันเถอะ!

การทำงานกับข้อมูลเชิงพื้นที่ใน Python

Preparing Video For Download...