ทางเลือกแทน Boxplot
แนวทางปฏิบัติที่ดีที่สุดสำหรับการสร้างภาพข้อมูลใน R

Nick Strayer
Instructor
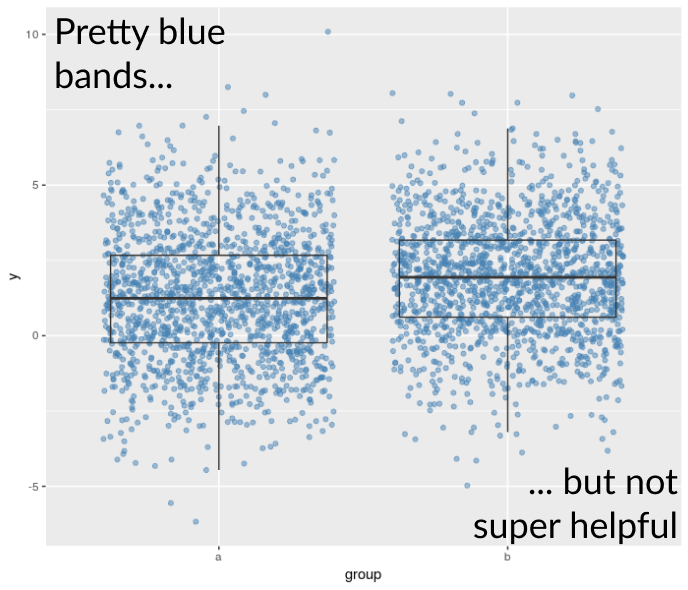
ข้อจำกัดของ Boxplot กับ Jitter
- การกระจายจุดข้อมูลรับมือกับความซ้อนทับได้จำกัด
- ยากต่อการประเมินความหนาแน่นของข้อมูล
มีตัวเลือกอะไรอีกบ้าง?
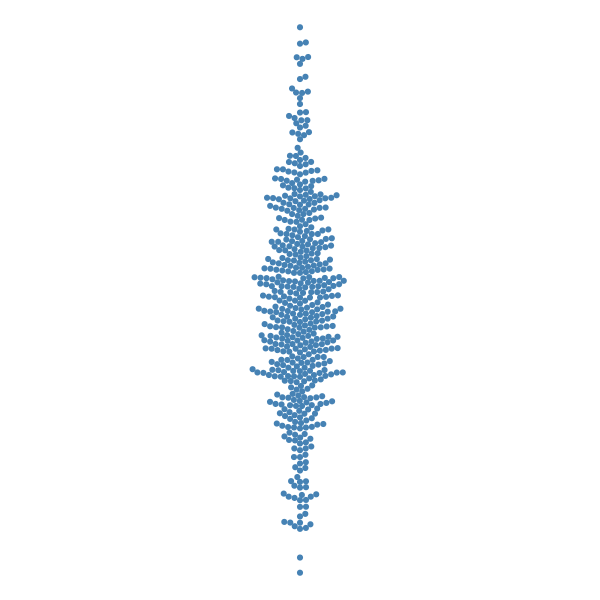
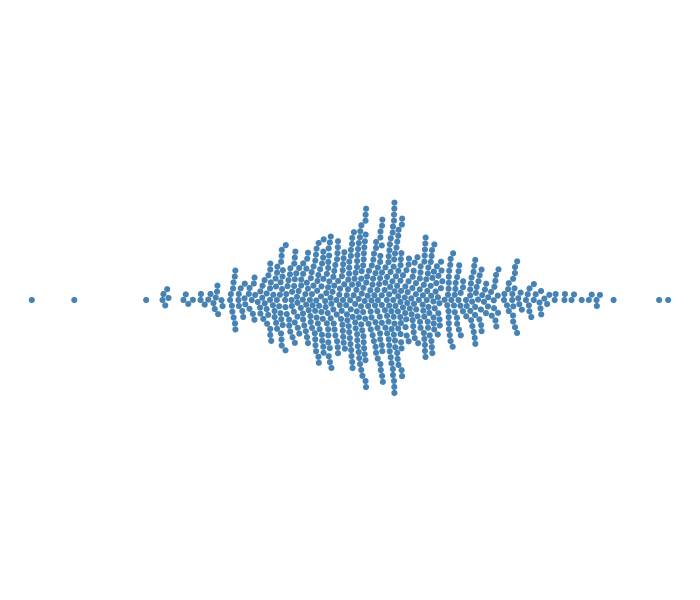
Beeswarm plots
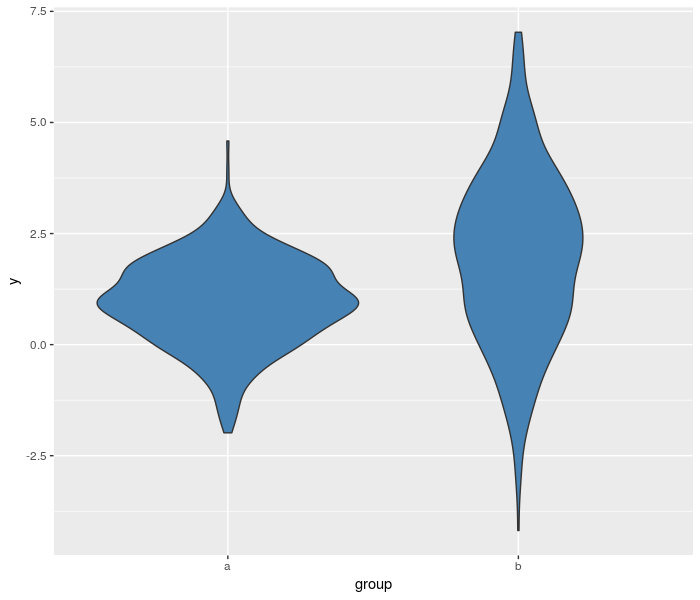
Violin plots

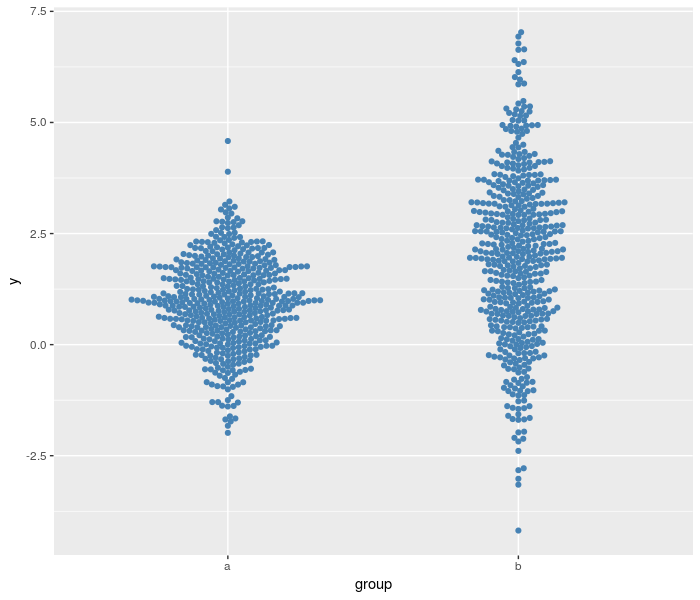
ข้อดีของ Beeswarm
- จุดข้อมูลแต่ละจุด
- รูปร่างของการกระจาย
ข้อเสียของ Beeswarm
- ใช้งานยากเมื่อข้อมูลมีจำนวนมาก
- การซ้อนทับกันไม่มีรูปแบบที่แน่นอน

ข้อดีของ Violin
- ข้อมูลทุกจุดมีผลต่อกราฟ
- ไม่ต้องแสดงทุกจุด จึงเหมาะกับข้อมูลจำนวนมาก

ข้อเสียของ Violin
- การเลือกความกว้าง Kernel
- ไม่แสดงจุดข้อมูลทุกจุด