Моделювання даних у Tidyverse
Albert Y. Kim
Assistant Professor of Statistical and Data Sciences
library(dplyr)
library(moderndive)
# Перегляньмо лише окремі змінні:
house_prices %>%
select(price, sqft_living, condition, waterfront) %>%
glimpse()
Observations: 21,613
Variables: 4
$ price <dbl> 221900, 538000, 180000, 604000...
$ sqft_living <int> 1180, 2570, 770, 1960, 1680, 5420...
$ condition <fct> 3, 3, 3, 5, 3, 3, 3, 3, 3, 3, 3...


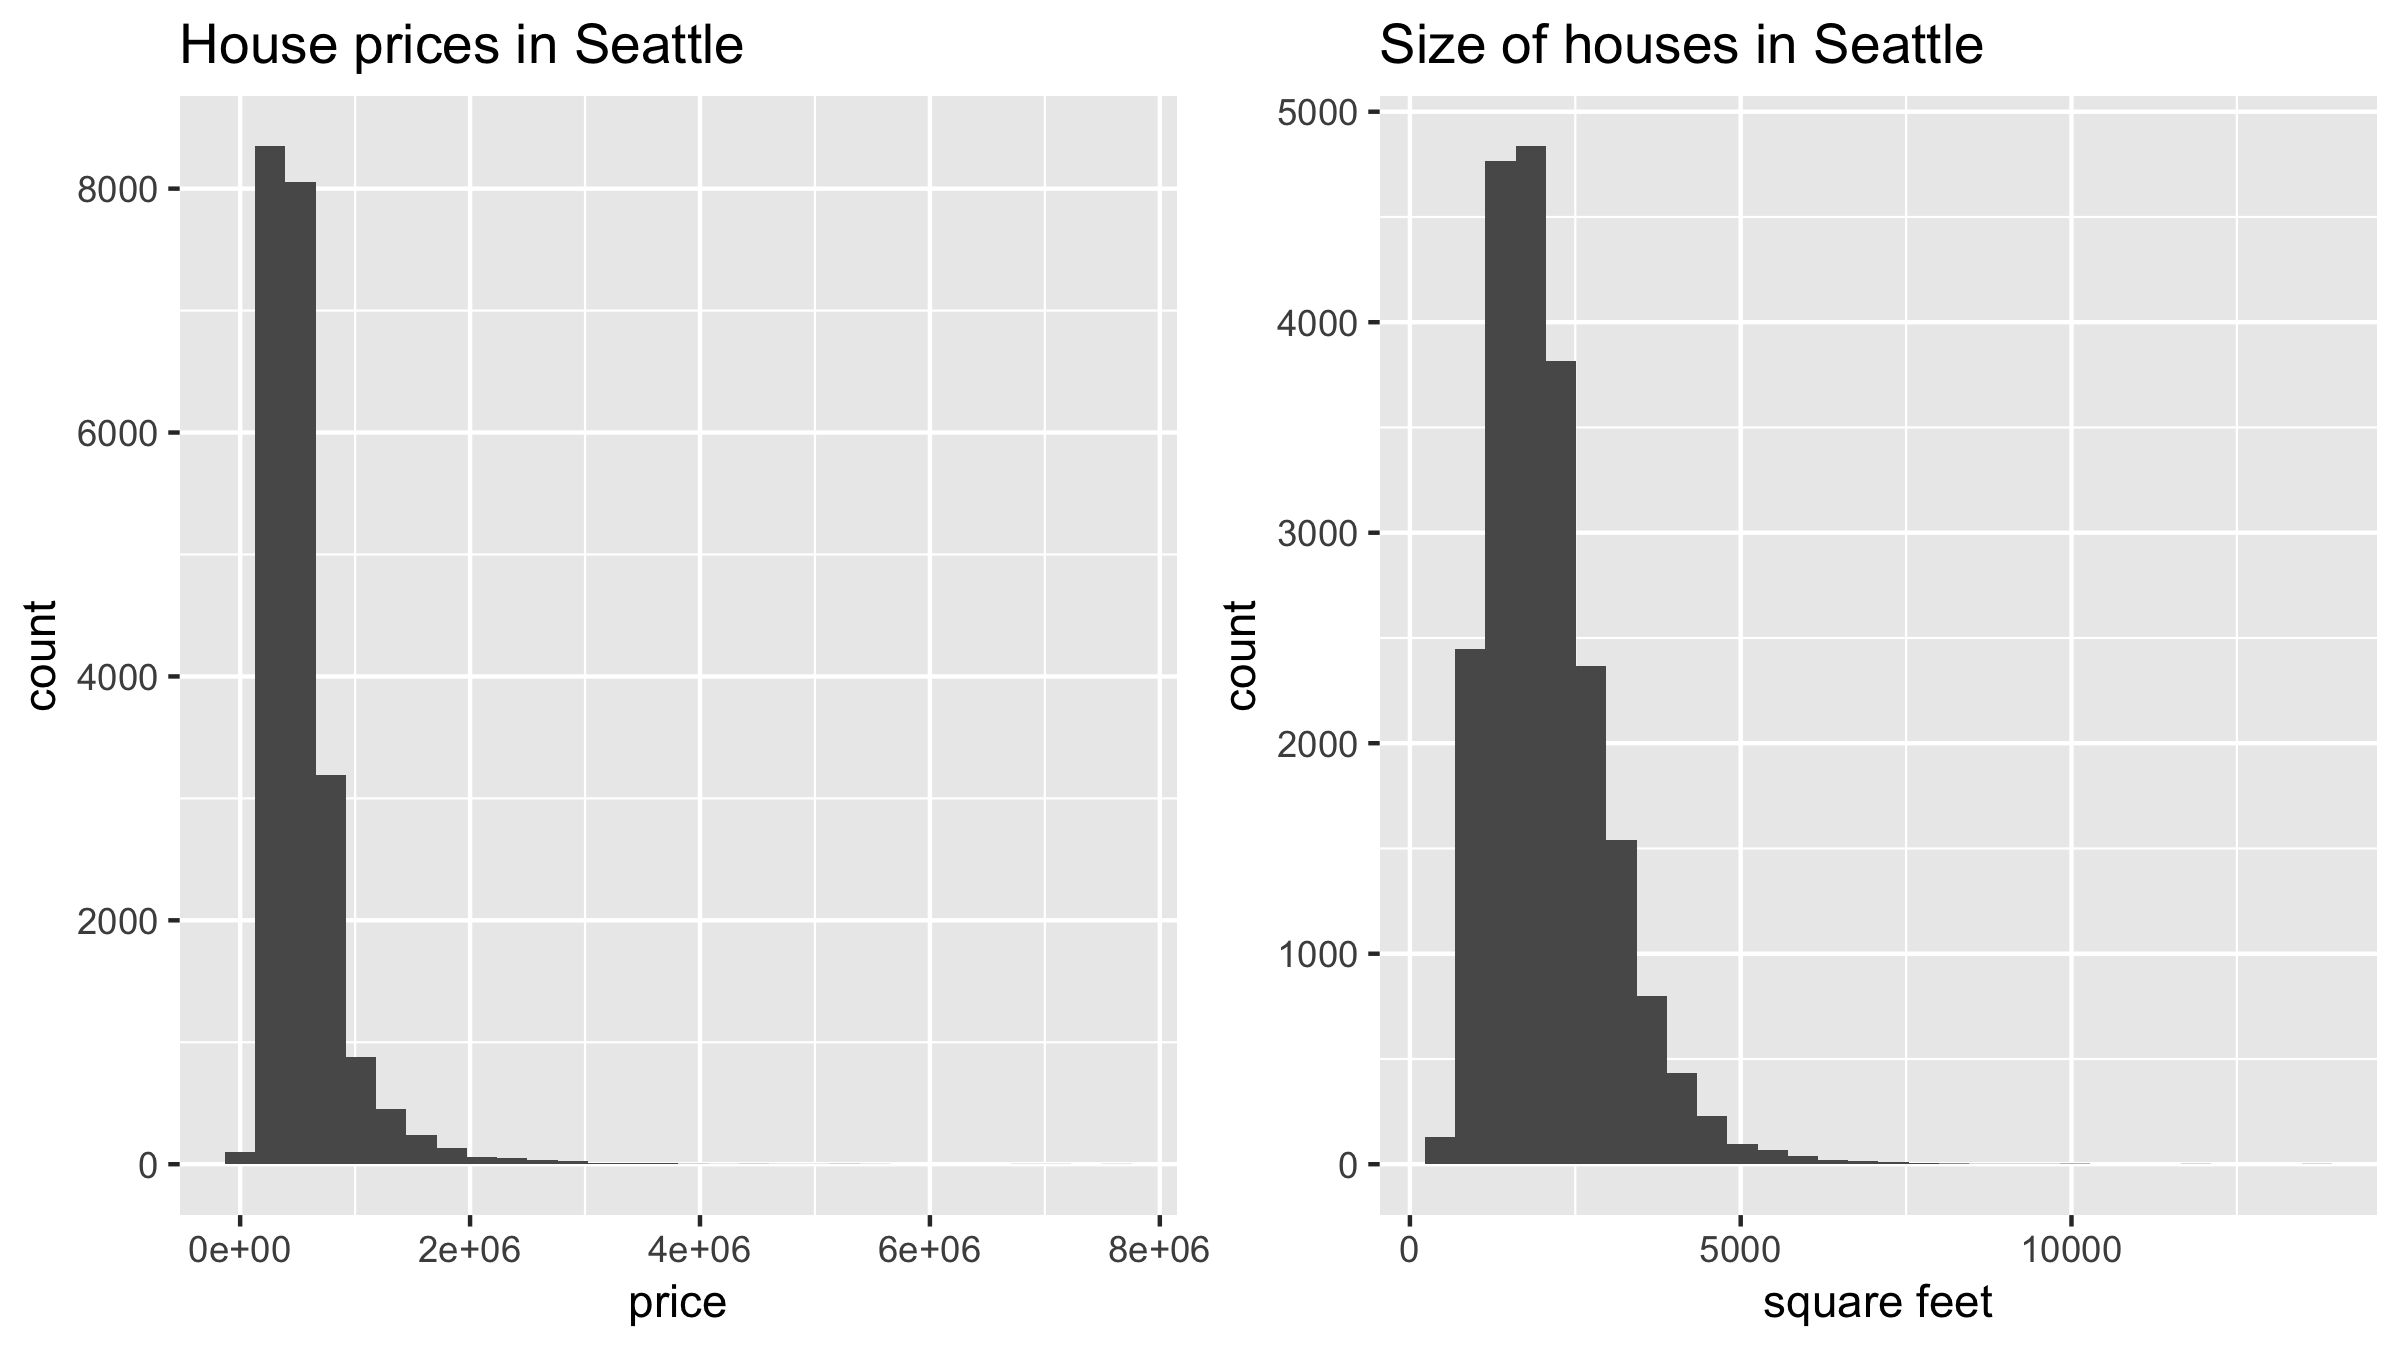
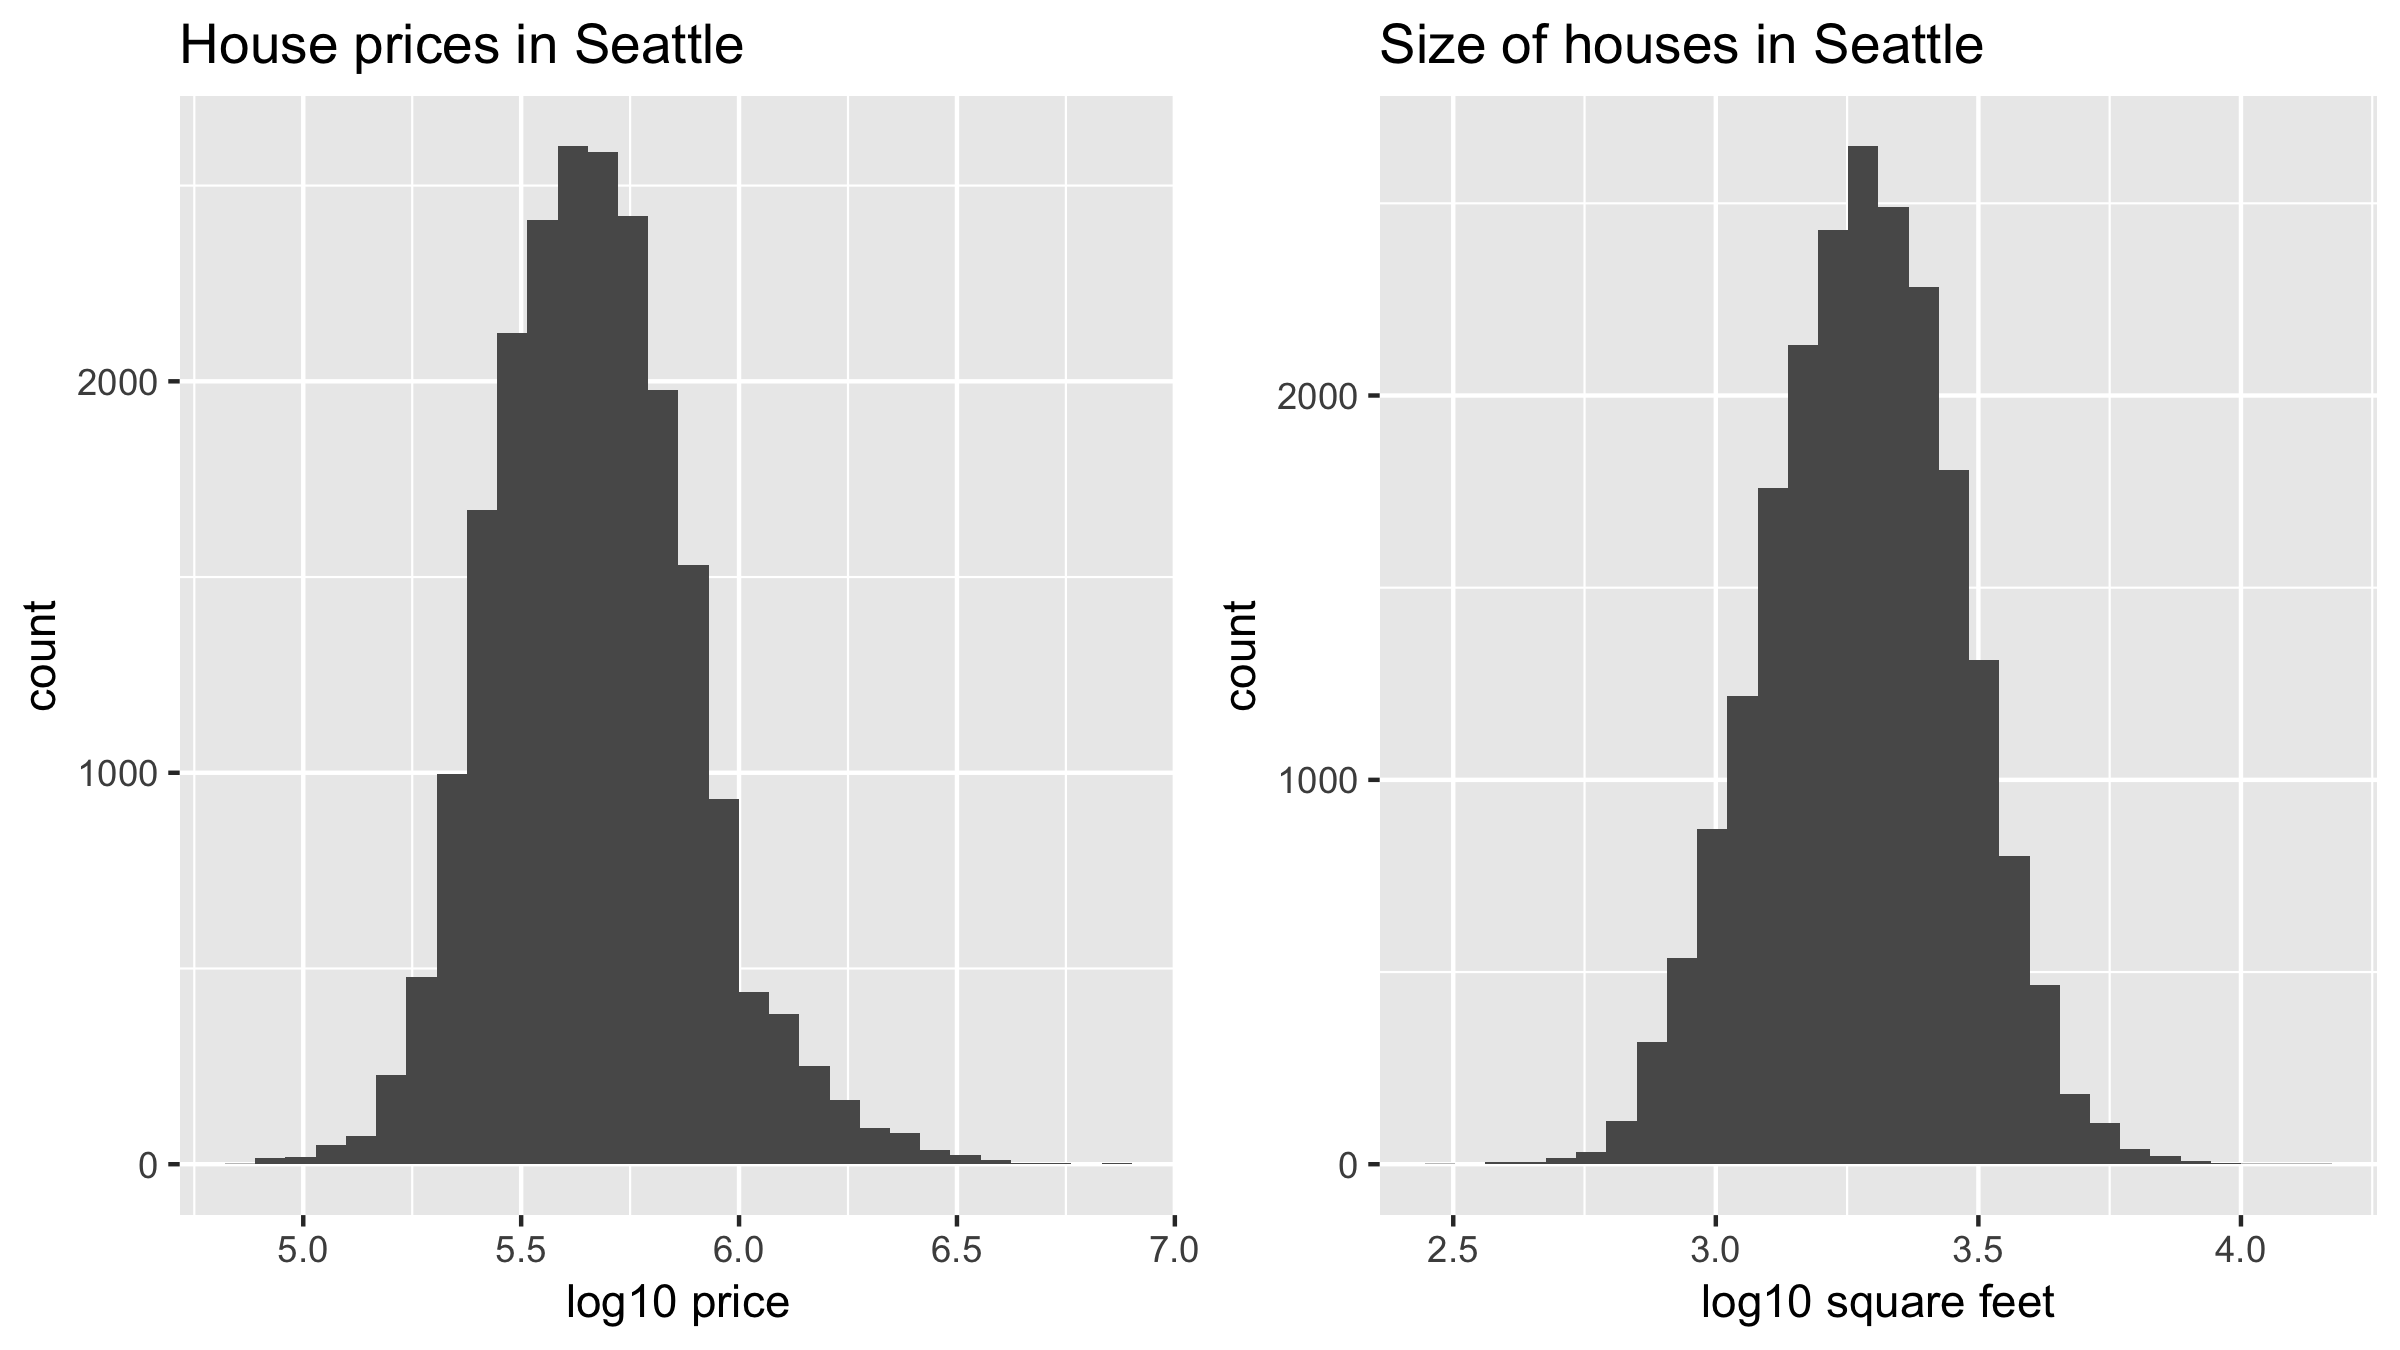
# Перетворення log10() для ціни та площі
house_prices <- house_prices %>%
mutate(
log10_price = log10(price),
log10_size = log10(sqft_living)
)
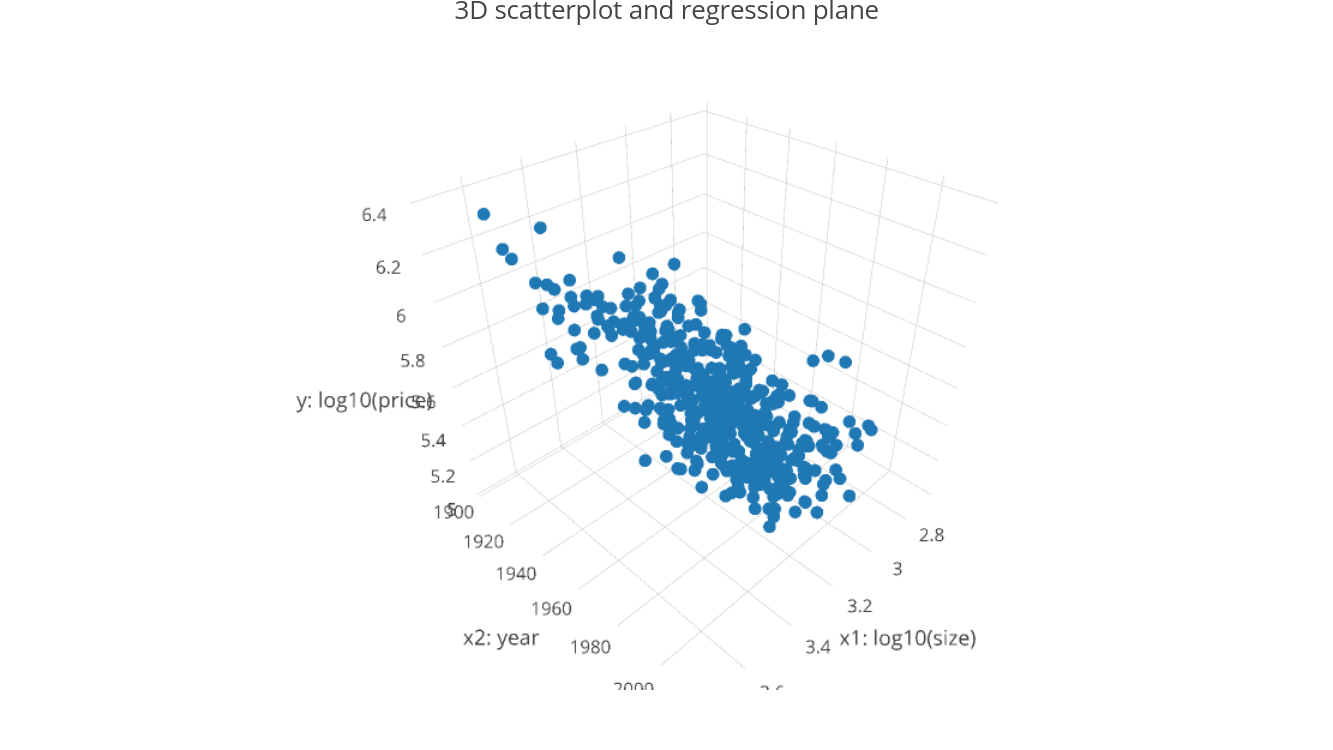
pricelog10_sizeyr_built3D-скатерплот для log10_price, log10_size і yr_built
3D-скатерплот із регресійною площиною (посилання на інтерактивну версію).
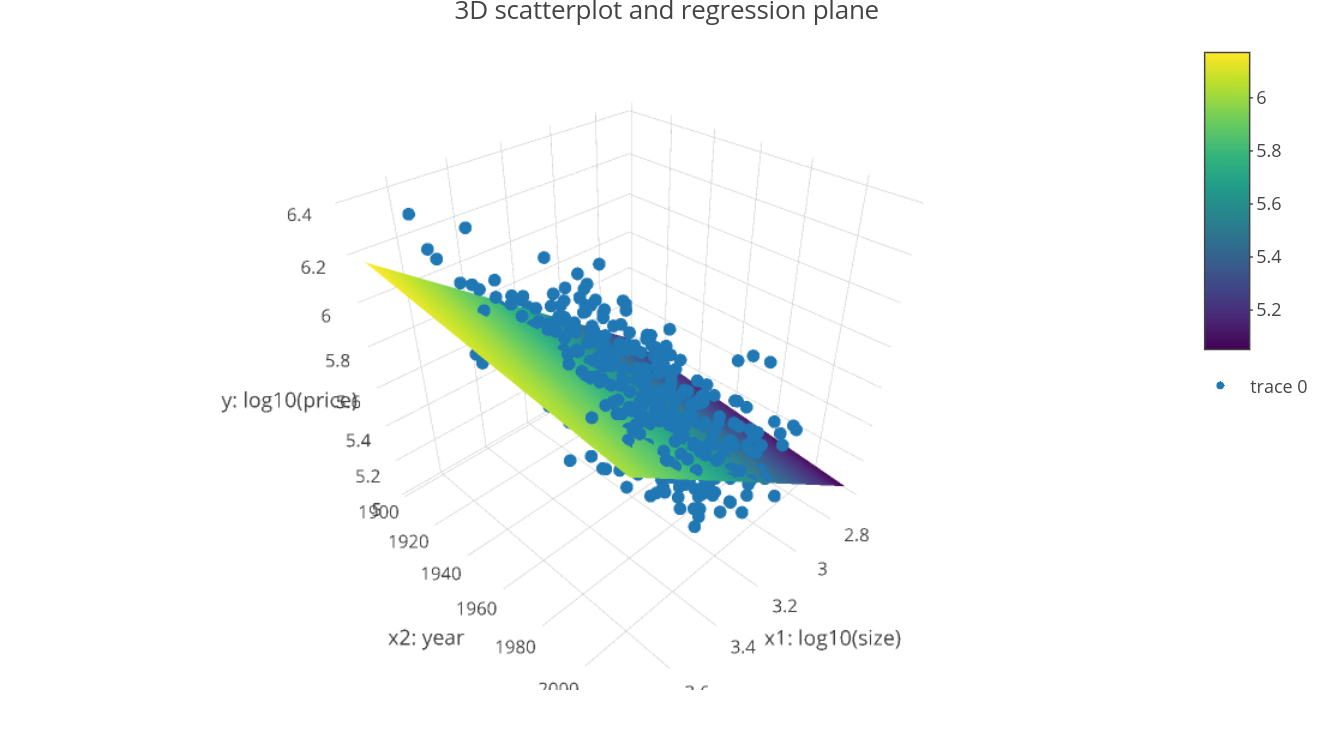
# Побудуйте регресійну модель за формулою: y ~ x1 + x2 model_price_1 <- lm(log10_price ~ log10_size + yr_built, data = house_prices)# Виведіть регресійну таблицю get_regression_table(model_price_1)
# A tibble: 3 x 7
term estimate std_error statistic p_value...
<chr> <dbl> <dbl> <dbl> <dbl>...
1 intercept 5.38 0.0754 71.4 0...
2 log10_size 0.913 0.00647 141. 0...
3 yr_built -0.00138 0.00004 -33.8 0...
Моделювання даних у Tidyverse