โมเดล SARIMA

ARIMA Models ใน Python

James Fulton

Climate informatics researcher

โมเดล SARIMA

Seasonal ARIMA = SARIMA

  • อันดับที่ไม่ใช่ฤดูกาล
    • p: อันดับ autoregressive
    • d: อันดับการ differencing
    • q: อันดับ moving average

SARIMA(p,d,q)(P,D,Q)$_S$

  • อันดับตามฤดูกาล
    • P: อันดับ autoregressive ตามฤดูกาล
    • D: อันดับ differencing ตามฤดูกาล
    • Q: อันดับ moving average ตามฤดูกาล
    • S: จำนวน time steps ต่อหนึ่งรอบ
ARIMA Models ใน Python

โมเดล SARIMA

โมเดล ARIMA(2,0,1) : $$y_t = a_1 y_{t-1} + a_2 y_{t-2} + m_1 \epsilon_{t-1} + \epsilon_t$$

โมเดล SARIMA(0,0,0)(2,0,1)$_7$: $$y_t = a_7 y_{t-7} + a_{14} y_{t-14} + m_7 \epsilon_{t-7} + \epsilon_t$$

ARIMA Models ใน Python

การ Fit โมเดล SARIMA

# Imports
statsmodels.tsa.statespace.sarimax import SARIMAX

# Instantiate model model = SARIMAX(df, order=(p,d,q), seasonal_order=(P,D,Q,S))
# Fit model results = model.fit()
ARIMA Models ใน Python

Seasonal differencing

ลบค่า time series ของหนึ่งฤดูกาลที่ผ่านมาออก

$$\Delta y_t = y_t - y_{t-S}$$

# Take the seasonal difference
df_diff = df.diff(S)
ARIMA Models ใน Python

การ Differencing สำหรับโมเดล SARIMA

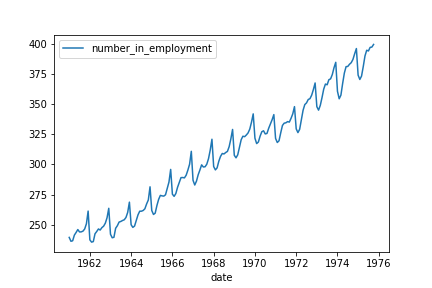
Time series

ARIMA Models ใน Python

การ Differencing สำหรับโมเดล SARIMA

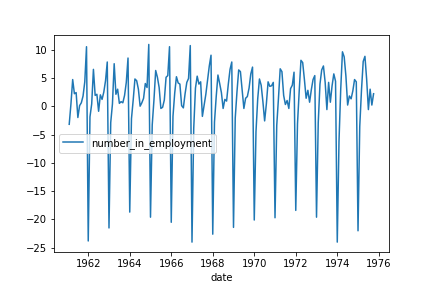
ผลต่างอันดับหนึ่งของ time series

ARIMA Models ใน Python

การ Differencing สำหรับโมเดล SARIMA

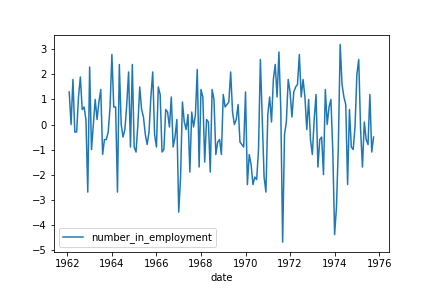
ผลต่างอันดับหนึ่งและ seasonal difference อันดับหนึ่งของ time series

ARIMA Models ใน Python

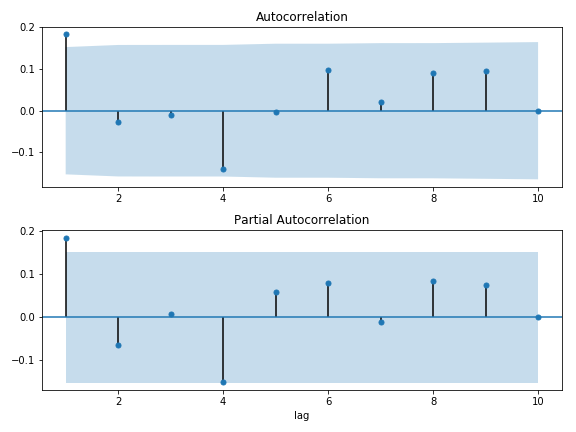
การหาค่า p และ q

ARIMA Models ใน Python

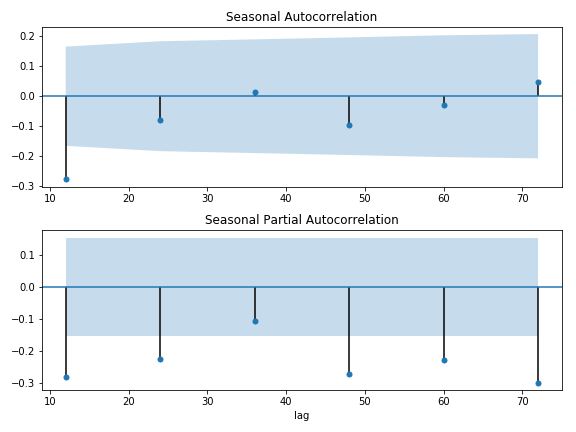
การหาค่า P และ Q

ARIMA Models ใน Python

การพล็อต Seasonal ACF และ PACF

# Create figure
fig, (ax1, ax2) = plt.subplots(2,1)

# Plot seasonal ACF
plot_acf(df_diff,  lags=[12,24,36,48,60,72], ax=ax1)

# Plot seasonal PACF
plot_pacf(df_diff, lags=[12,24,36,48,60,72], ax=ax2)

plt.show()
ARIMA Models ใน Python

มาฝึกกันเถอะ!

ARIMA Models ใน Python

Preparing Video For Download...