การวิเคราะห์ข้อมูลเชิงสำรวจเบื้องต้น

Statistical Thinking in Python (ตอนที่ 1)

Justin Bois

Teaching Professor at the California Institute of Technology

การวิเคราะห์ข้อมูลเชิงสำรวจ

  • กระบวนการจัดระเบียบ พล็อตกราฟ และสรุปชุดข้อมูล
Statistical Thinking in Python (ตอนที่ 1)


"การวิเคราะห์ข้อมูลเชิงสำรวจไม่อาจเป็นคำตอบทั้งหมด แต่ไม่มีสิ่งใดทำหน้าที่เป็นรากฐานได้ดีกว่านี้" —John Tukey

Statistical Thinking in Python (ตอนที่ 1)

ผลการเลือกตั้ง Swing State ของสหรัฐฯ ปี 2008
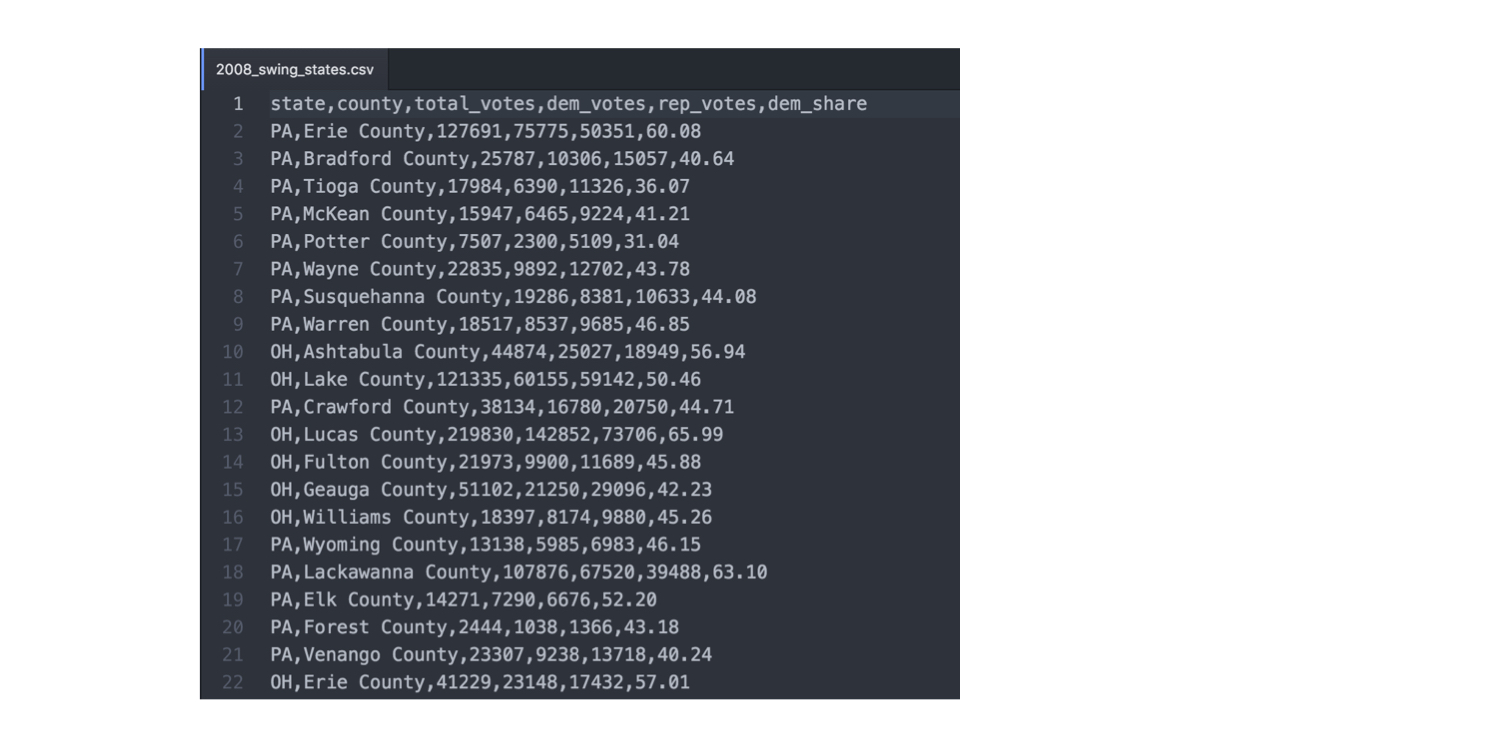
ch1-1.006.png

1 Data retrieved from Data.gov (https://www.data.gov/)
Statistical Thinking in Python (ตอนที่ 1)

ผลการเลือกตั้ง Swing State ของสหรัฐฯ ปี 2008
import pandas as pd
df_swing = pd.read_csv('2008_swing_states.csv')
df_swing[['state', 'county', 'dem_share']]
    state              county  dem_share
0      PA         Erie County      60.08
1      PA     Bradford County      40.64
2      PA        Tioga County      36.07
3      PA       McKean County      41.21
4      PA       Potter County      31.04
5      PA        Wayne County      43.78
6      PA  Susquehanna County      44.08
7      PA       Warren County      46.85
8      OH    Ashtabula County      56.94
1 Data retrieved from Data.gov (https://www.data.gov/)
Statistical Thinking in Python (ตอนที่ 1)

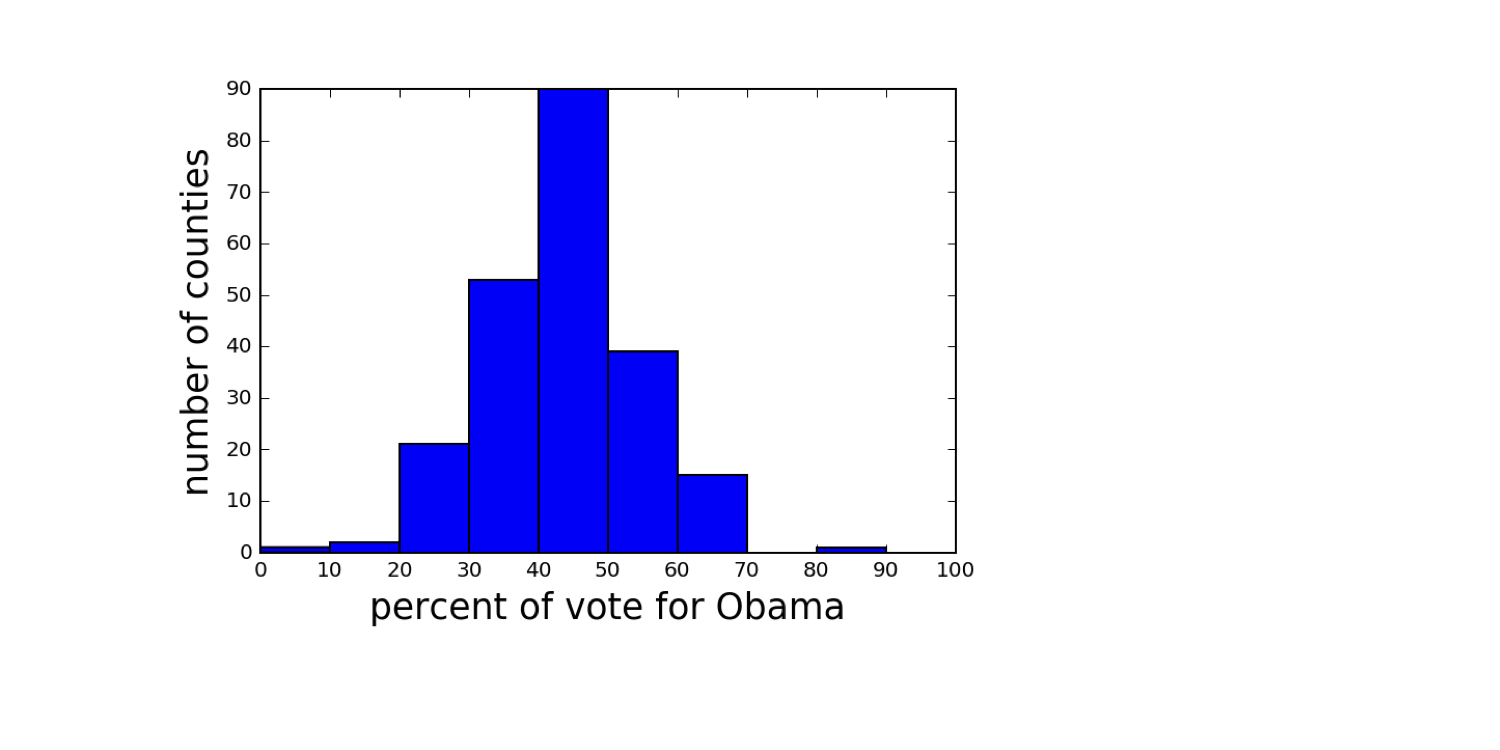
ผลการเลือกตั้ง Swing State ของสหรัฐฯ ปี 2008

ch1-1.009.png

1 Data retrieved from Data.gov (https://www.data.gov/)
Statistical Thinking in Python (ตอนที่ 1)

มาฝึกกันเถอะ!

Statistical Thinking in Python (ตอนที่ 1)

Preparing Video For Download...