แนะนำ Seaborn
การสร้างภาพข้อมูลระดับกลางด้วย Seaborn

Chris Moffitt
Instructor
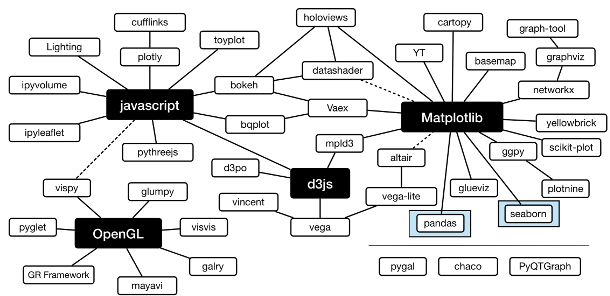
ภูมิทัศน์การสร้างภาพข้อมูลด้วย Python
- ภูมิทัศน์การสร้างภาพข้อมูลด้วย Python มีความซับซ้อนและอาจทำให้สับสนได้
Matplotlib
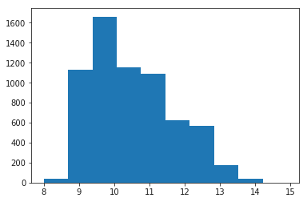
matplotlibเป็นพื้นฐานสำหรับการสร้างภาพข้อมูลของ Seaborn- ใช้งานแบบเดี่ยวเพื่อพล็อตข้อมูลได้เช่นกัน
import matplotlib.pyplot as plt import pandas as pddf = pd.read_csv("wines.csv")fig, ax = plt.subplots() ax.hist(df['alcohol'])
Pandas
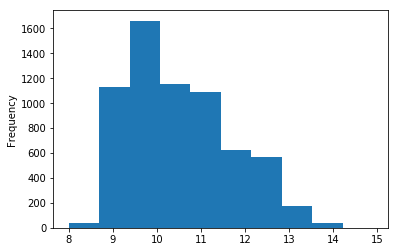
pandasเป็นไลบรารีพื้นฐานสำหรับวิเคราะห์ข้อมูล- รองรับการพล็อตข้อมูลเบื้องต้นด้วย
import pandas as pddf = pd.read_csv("wines.csv") df['alcohol'].plot.hist()
Seaborn histplot
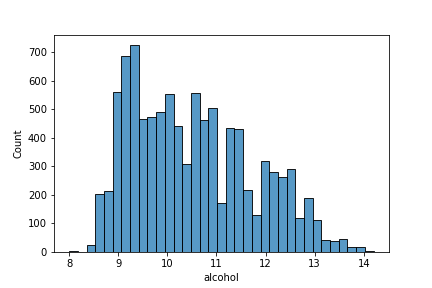
histplotคล้ายกับฮิสโตแกรมในตัวอย่างก่อนหน้า- โดยค่าเริ่มต้นจะสร้างฮิสโตแกรม แต่รองรับกราฟประเภทอื่นได้ด้วย
import seaborn as snssns.histplot(df['alcohol'])
Seaborn displot
displotใช้งานhistplotและฟังก์ชันอื่นสำหรับกราฟการกระจาย- โดยค่าเริ่มต้นจะสร้างฮิสโตแกรม แต่รองรับกราฟประเภทอื่นได้ด้วย
import seaborn as snssns.displot(df['alcohol'], kind='kde')
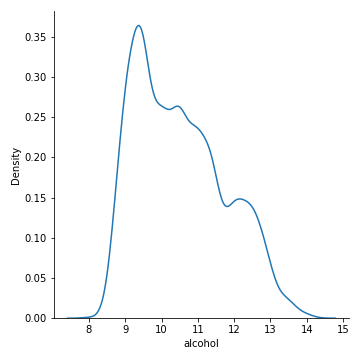
ฮิสโตแกรม pandas เทียบกับ Displot
- ฮิสโตแกรมจาก Pandas
df['alcohol'].plot.hist()- แสดงความถี่จริงของการสังเกต
- ไม่มีเส้นขอบแท่ง
- ช่วงถังกว้าง
- ไม่มีป้ายกำกับแกน x
- displot จาก Seaborn
sns.displot(df['alcohol'])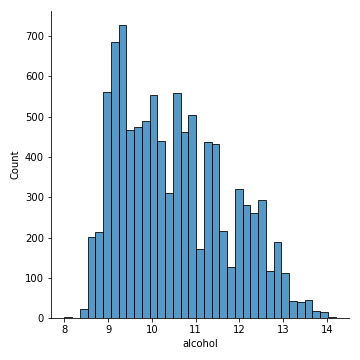
- มีป้ายกำกับแกน x อัตโนมัติ
- ชุดสีที่นุ่มนวล
- กราฟดูเรียบร้อยกว่า

