การใช้ FacetGrid, catplot และ lmplot
การสร้างภาพข้อมูลระดับกลางด้วย Seaborn

Chris Moffitt
Instructor
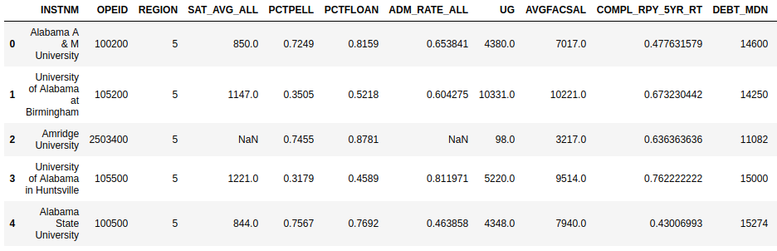
Tidy data
- กราฟแบบ grid ของ Seaborn ต้องการข้อมูลในรูปแบบ "tidy format"
- หนึ่งการสังเกตต่อหนึ่งแถวข้อมูล
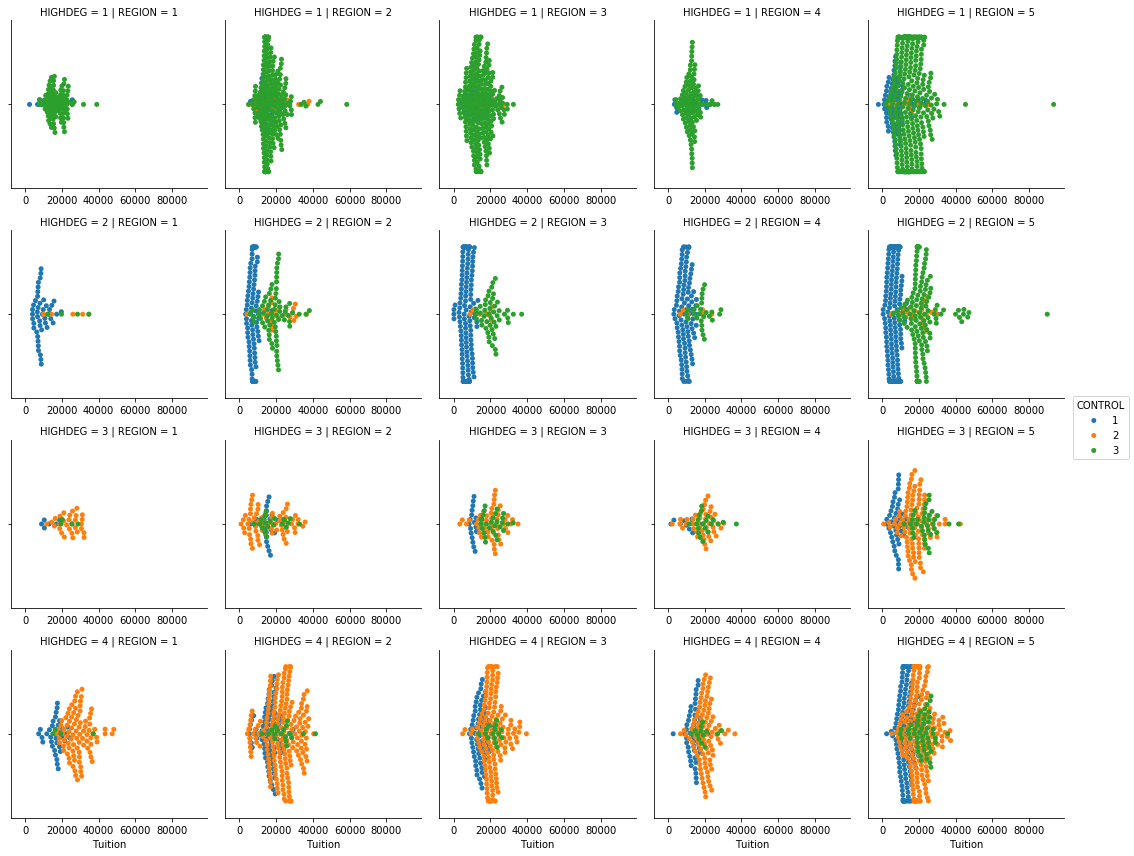
ตัวอย่าง FacetGrid แบบ Categorical
g = sns.FacetGrid(df, col='HIGHDEG')
g.map(sns.boxplot, 'Tuition',
      order=['1', '2', '3', '4'])
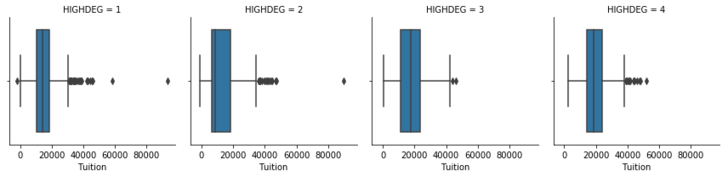
catplot()
catplotเป็นวิธีที่ง่ายกว่าในการใช้FacetGridกับข้อมูลเชิงหมวดหมู่- รวมขั้นตอน facetting และ mapping ไว้ในฟังก์ชันเดียว
sns.catplot(x="Tuition", data=df,
            col="HIGHDEG", kind="box")
FacetGrid สำหรับ Regression
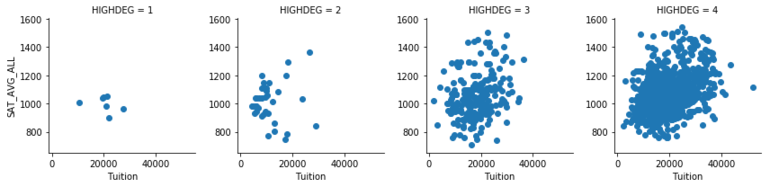
FacetGrid()ใช้กับกราฟแบบ scatter หรือ regression ได้เช่นกัน
g = sns.FacetGrid(df, col='HIGHDEG')
g.map(plt.scatter, 'Tuition', 'SAT_AVG_ALL')
lmplot
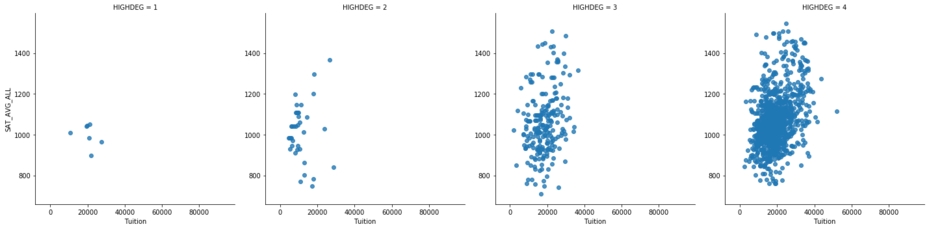
lmplotพล็อตกราฟ scatter และ regression บนFacetGrid
sns.lmplot(data=df, x="Tuition", y="SAT_AVG_ALL",
           col="HIGHDEG", fit_reg=False)
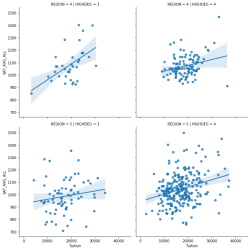
lmplot พร้อม Regression
sns.lmplot(data=df, x="Tuition", y="SAT_AVG_ALL",
           col="HIGHDEG", row="REGION")