Графіки регресії
Середній рівень візуалізації даних із Seaborn

Chris Moffitt
Instructor
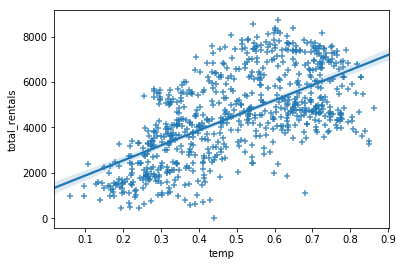
Побудова з regplot()
sns.regplot(data=df, x='temp',
            y='total_rentals', marker='+')
Оцінювання регресії з residplot()
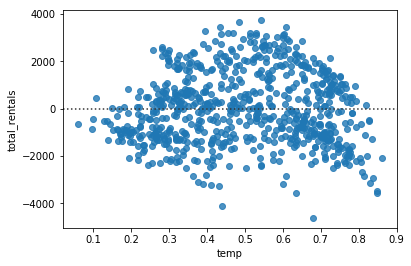
- Графік резидуалів допомагає оцінити якість моделі
- У Seaborn це робить функція
residplot
sns.residplot(data=df, x='temp', y='total_rentals')
Поліноміальна регресія
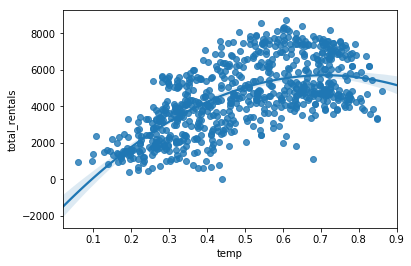
- Seaborn підтримує поліноміальну регресію через параметр
order
sns.regplot(data=df, x='temp',
            y='total_rentals', order=2)
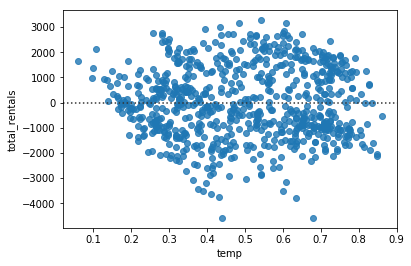
residplot з поліноміальною регресією
sns.residplot(data=df, x='temp',
              y='total_rentals', order=2)
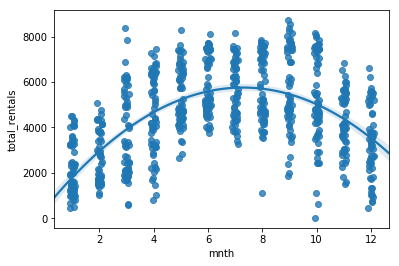
Категоріальні значення
sns.regplot(data=df, x='mnth', y='total_rentals',
            x_jitter=.1, order=2)
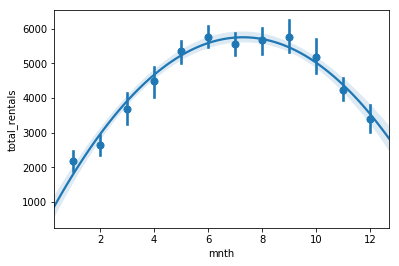
Оцінювачі
- У деяких випадках
x_estimatorкорисний для підсвічування трендів
sns.regplot(data=df, x='mnth', y='total_rentals',
            x_estimator=np.mean, order=2)
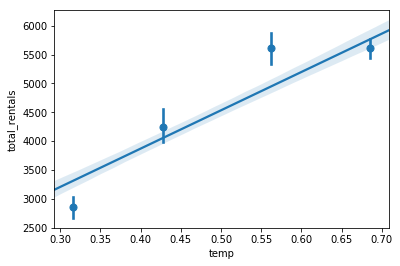
Бінування даних
x_binsдає змогу розбити дані на дискретні кошики- Лінія регресії все одно будується за всіма даними
sns.regplot(data=df,x='temp',y='total_rentals',
            x_bins=4)