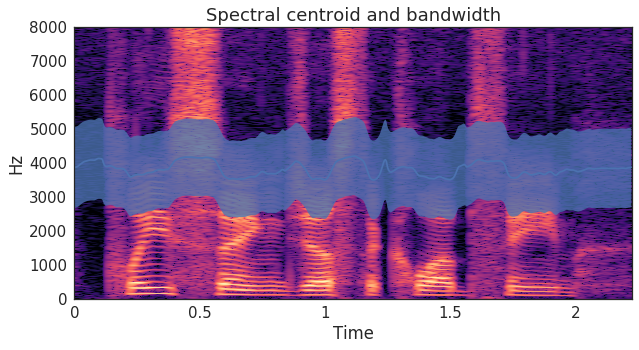
Machine Learning for Time Series Data in Python
Chris Holdgraf
Fellow, Berkeley Institute for Data Science
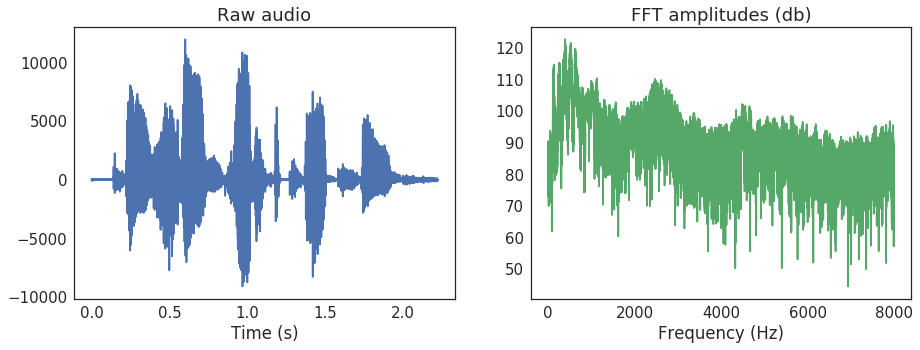

librosaspecshow() function# Import the functions we'll use for the STFT
from librosa.core import stft, amplitude_to_db
from librosa.display import specshow
import matplotlib.pyplot as plt
# Calculate our STFT
HOP_LENGTH = 2**4
SIZE_WINDOW = 2**7
audio_spec = stft(audio, hop_length=HOP_LENGTH, n_fft=SIZE_WINDOW)
# Convert into decibels for visualization
spec_db = amplitude_to_db(audio_spec)
# Visualize
fig, ax = plt.subplots()
specshow(spec_db, sr=sfreq, x_axis='time', 
         y_axis='hz', hop_length=HOP_LENGTH, ax=ax)

# Calculate the spectral centroid and bandwidth for the spectrogram
bandwidths = lr.feature.spectral_bandwidth(S=spec)[0]
centroids = lr.feature.spectral_centroid(S=spec)[0]
# Display these features on top of the spectrogram
fig, ax = plt.subplots()
specshow(spec, x_axis='time', y_axis='hz', hop_length=HOP_LENGTH, ax=ax)
ax.plot(times_spec, centroids)
ax.fill_between(times_spec, centroids - bandwidths / 2, 
                centroids + bandwidths / 2, alpha=0.5)
centroids_all = []
bandwidths_all = []
for spec in spectrograms:
    bandwidths = lr.feature.spectral_bandwidth(S=lr.db_to_amplitude(spec))
    centroids = lr.feature.spectral_centroid(S=lr.db_to_amplitude(spec))
    # Calculate the mean spectral bandwidth
    bandwidths_all.append(np.mean(bandwidths))  
    # Calculate the mean spectral centroid
    centroids_all.append(np.mean(centroids))  
# Create our X matrix
X = np.column_stack([means, stds, maxs, tempo_mean, 
                     tempo_max, tempo_std, bandwidths_all, centroids_all])
Machine Learning for Time Series Data in Python