Timeseries kinds and applications
Machine Learning for Time Series Data in Python

Chris Holdgraf
Fellow, Berkeley Institute for Data Science
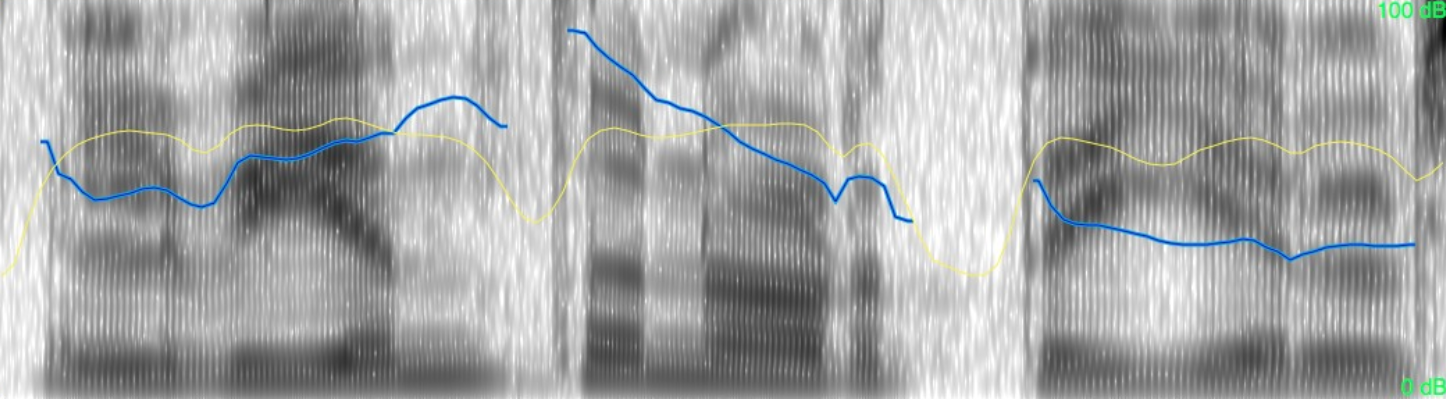
Time Series
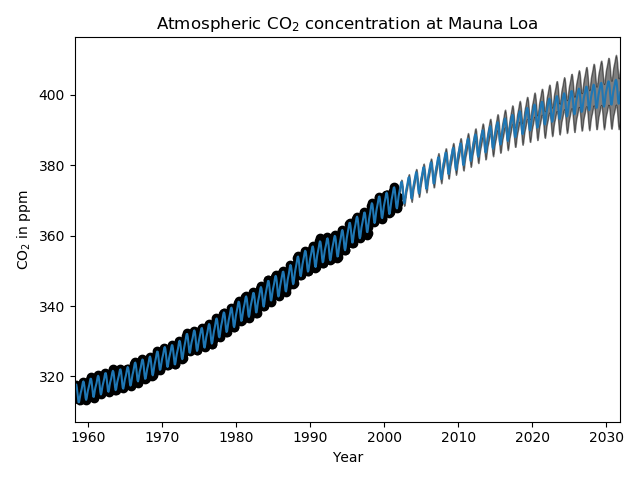
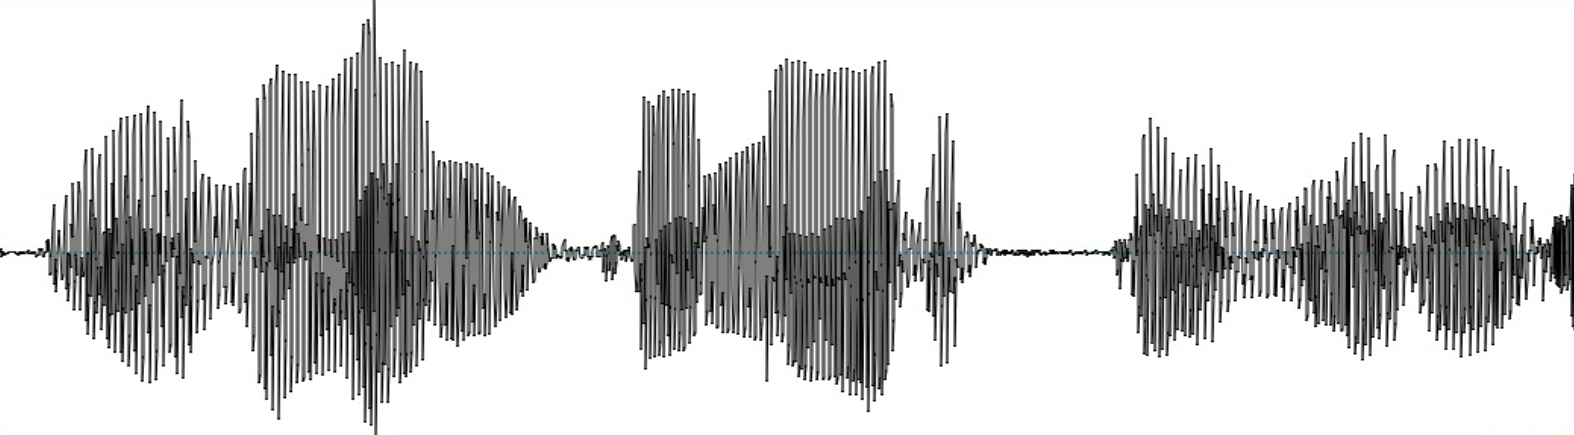
Time Series
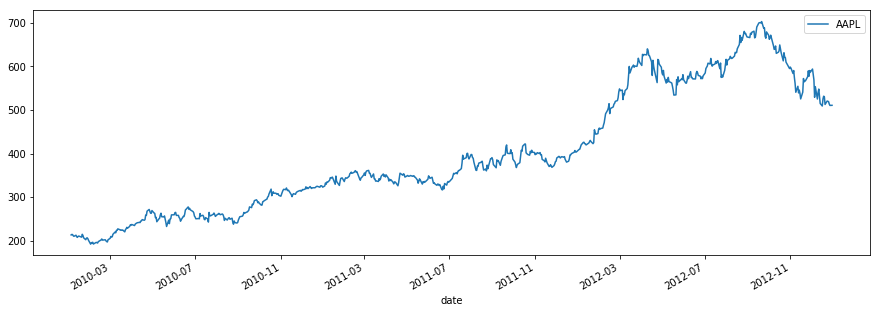
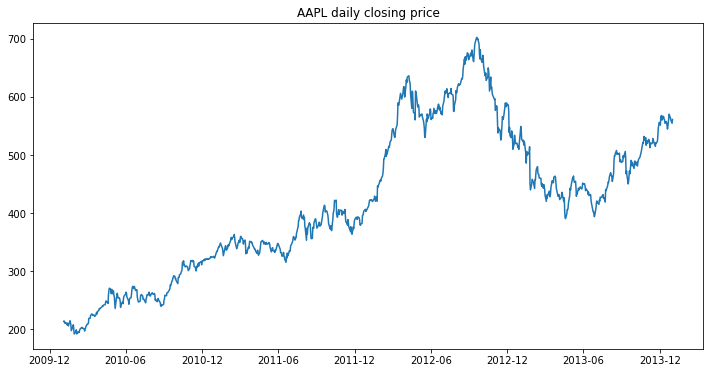
A timeseries plot
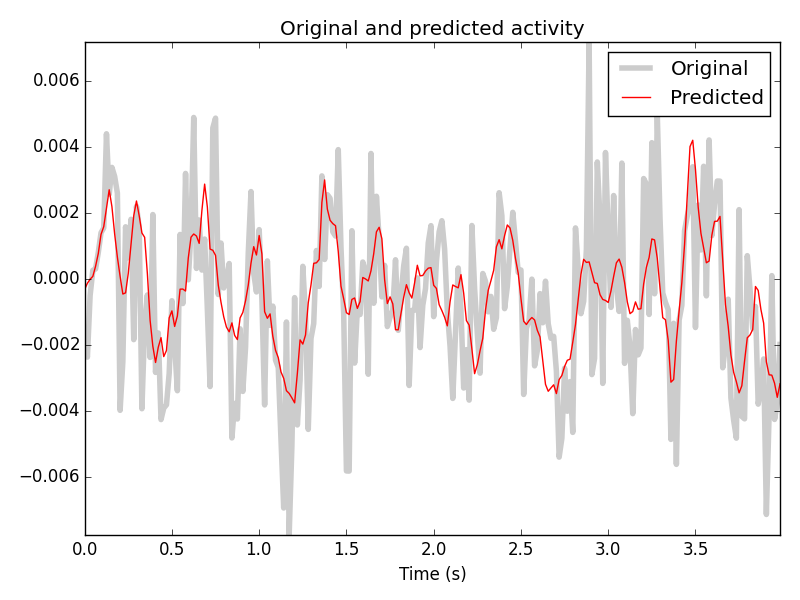
Why machine learning?
We can use really big data and really complicated data
Why machine learning?
Why combine these two?