การสร้างกราฟใหม่

ข้อมูลเชิงหมวดหมู่ใน Tidyverse

Emily Robinson

Data Scientist

Labs

ggplot(mtcars, aes(disp, mpg)) + geom_point() + 
  labs(x = "x axis label", y = "y axis label", title = "My title", 
       subtitle = "and a subtitle", caption = "even a caption!")
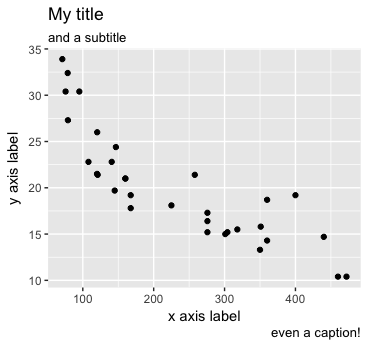
แผนภูมิกระจายที่มีหัวข้อ "My title", คำบรรยายย่อย "and a subtitle", ป้ายแกน y "y axis label", ป้ายแกน x "x axis label", และคำอธิบาย "even a caption!"

ข้อมูลเชิงหมวดหมู่ใน Tidyverse

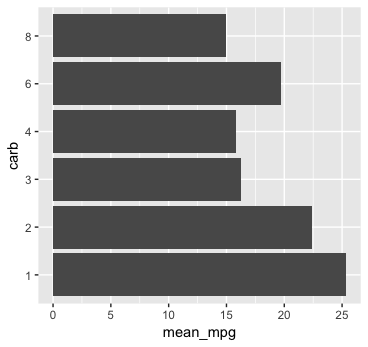
แผนภูมิแท่งที่มีแกน x เป็น "mean mpg" และแกน y เป็น "carb"

ข้อมูลเชิงหมวดหมู่ใน Tidyverse

Geom_text

initial_plot + geom_text(aes(label = round(mean_mpg)))
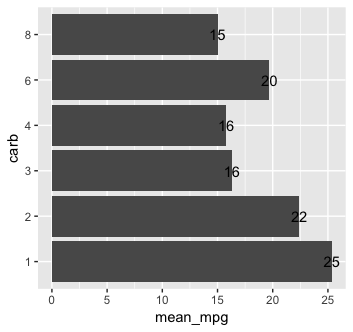
แผนภูมิแท่งเดิมแต่มีตัวเลข mean mpg แสดงซ้อนที่ด้านบนของแต่ละแท่ง

ข้อมูลเชิงหมวดหมู่ใน Tidyverse

การเลื่อนตำแหน่งข้อความ

initial_plot + 
  geom_text(aes(label = round(mean_mpg), y = mean_mpg + 2))
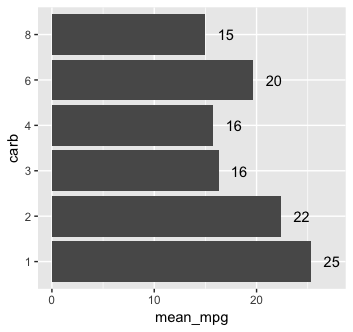
กราฟเดิมแต่ตัวเลขแสดงอยู่เหนือแต่ละแท่ง

ข้อมูลเชิงหมวดหมู่ใน Tidyverse

Theme

initial_plot + 
  geom_text(aes(label = round(mean_mpg), y = mean_mpg + 2)) + 
  theme(axis.text.x = element_blank(), axis.ticks.x = element_blank())
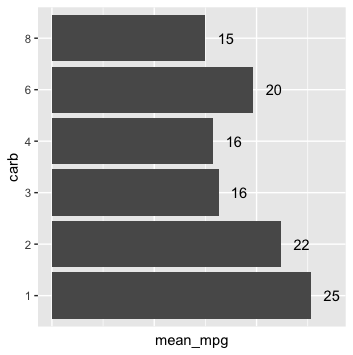
กราฟเดิมแต่ไม่มีป้ายกำกับแกน x และเครื่องหมายขีดบนแกน x

ข้อมูลเชิงหมวดหมู่ใน Tidyverse

มาฝึกกันเถอะ!

ข้อมูลเชิงหมวดหมู่ใน Tidyverse

Preparing Video For Download...