Machine Learning สำหรับการเงินด้วย Python
Nathan George
Data Science Professor
features = amd_df[['10d_close_pct', 'Adj_Volume']]

targets = amd_df['10d_future_close_pct']

print(type(features))
features = amd_df[['10d_close_pct', 'Adj_Volume']]
targets = amd_df['10d_future_close_pct']
print(type(features))
pandas.core.series.DataFrame
print(type(targets))
pandas.core.series.Series
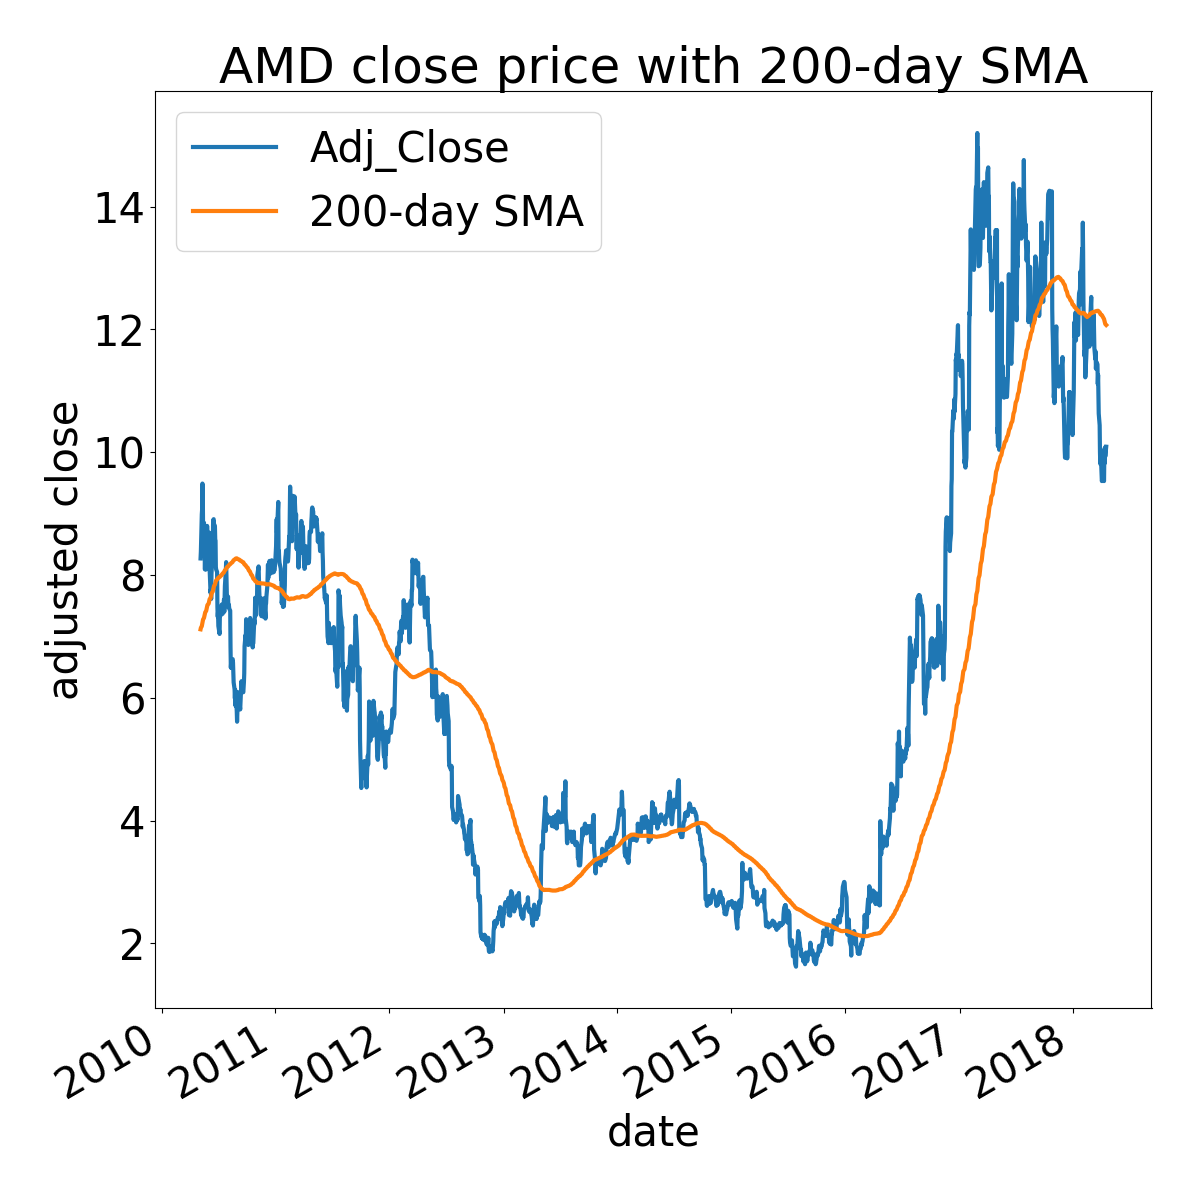
ค่าเฉลี่ยเคลื่อนที่:
import talib

amd_df['ma200'] = talib.SMA(amd_df['Adj_Close'].values, timeperiod=200)

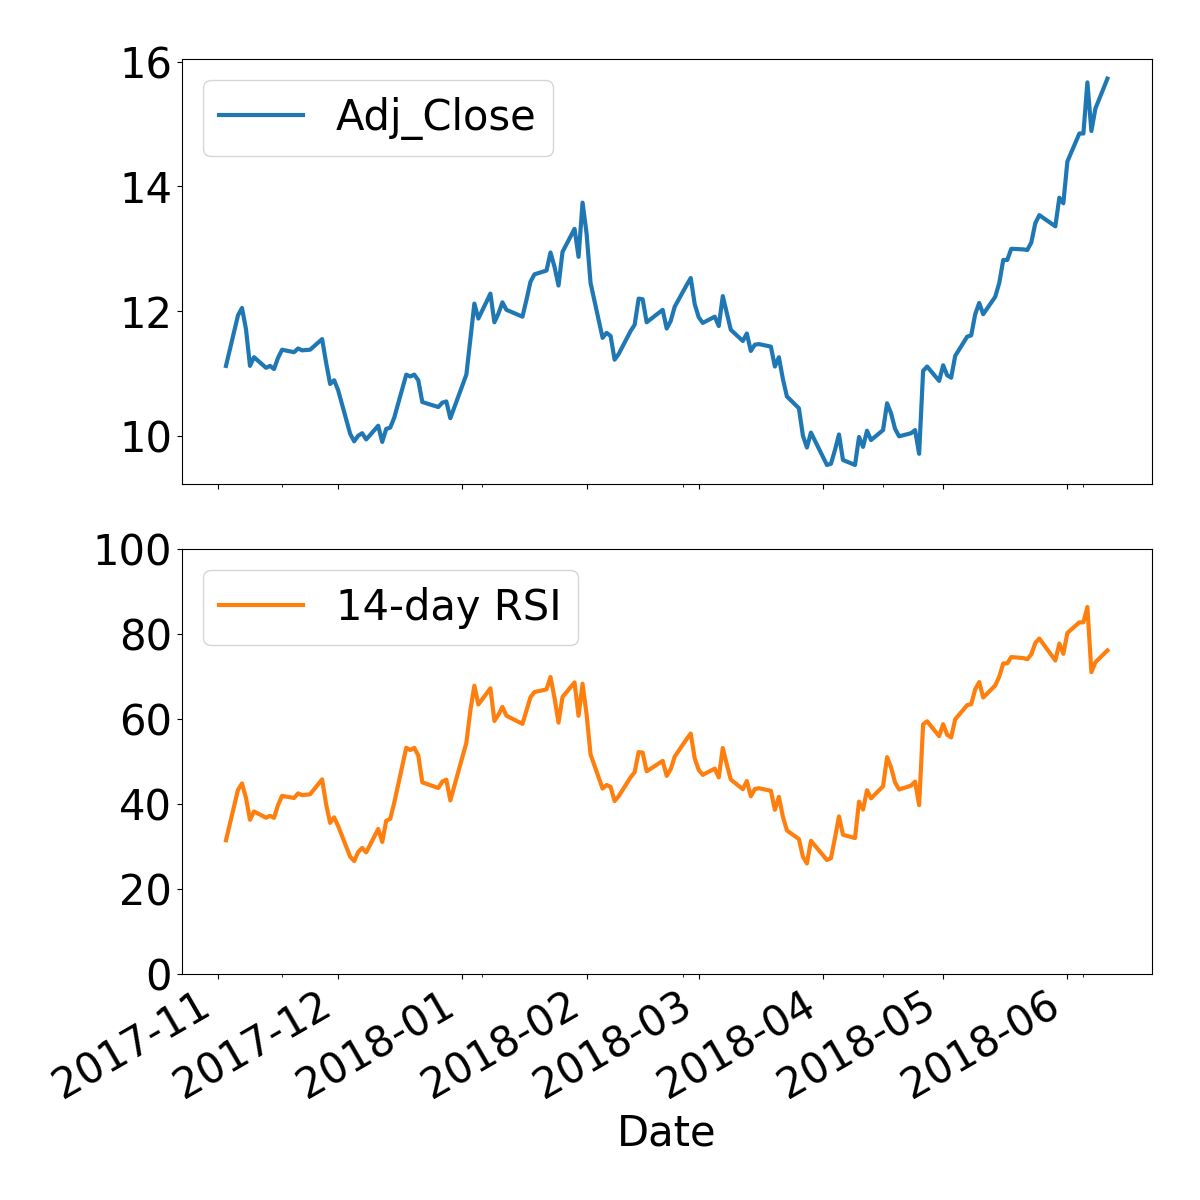
amd_df['rsi200'] = talib.RSI(amd_df['Adj_Close'].values, timeperiod=200)
import talib
amd_df['ma200'] = talib.SMA(amd_df['Adj_Close'].values, timeperiod=200)
amd_df['rsi200'] = talib.RSI(amd_df['Adj_Close'].values, timeperiod=200)
feature_names = ['10d_close_pct', 'ma200', 'rsi200']
features = amd_df[feature_names]
targets = amd_df['10d_future_close_pct']

feature_target_df = amd_df[feature_names + '10d_future_close_pct']
import seaborn as sns

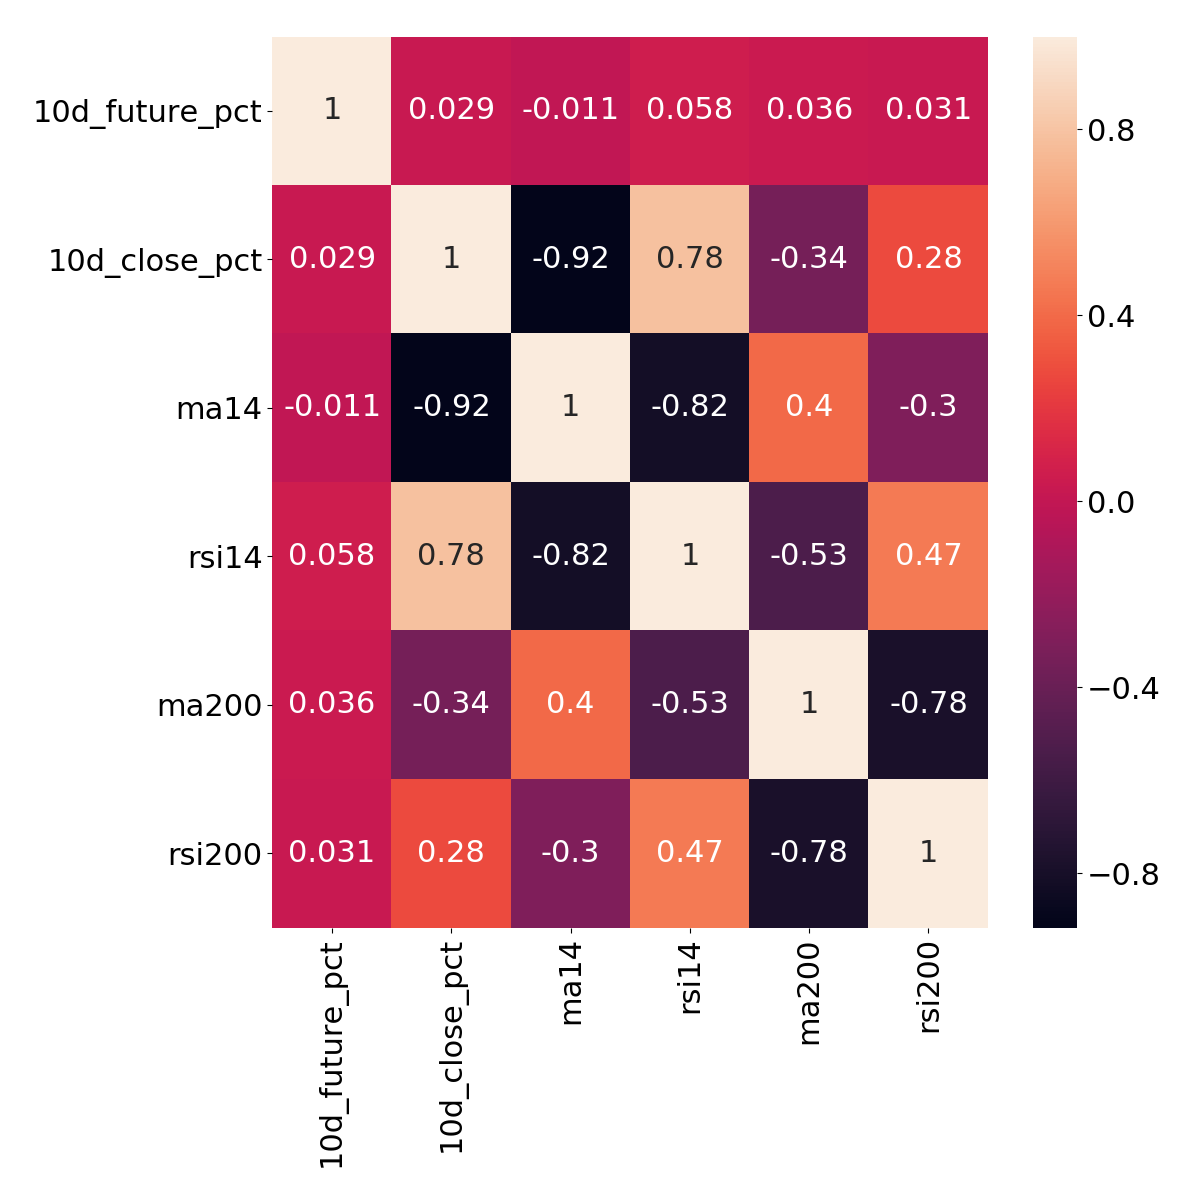
corr = feature_target_df.corr()
sns.heatmap(corr, annot=True)