Resampling ในฐานะ Monte Carlo simulation ประเภทพิเศษ

Monte Carlo Simulations ใน Python

Izzy Weber

Curriculum Manager, DataCamp

Resampling ในฐานะ Monte Carlo simulation ประเภทพิเศษ


Monte Carlo simulations

  • สุ่มตัวอย่างจากการแจกแจงความน่าจะเป็น
  • การแจกแจงอาจทราบหรือสมมติไว้ล่วงหน้า
  • อาศัยข้อมูลในอดีตหรือความเชี่ยวชาญในการเลือกการแจกแจงที่เหมาะสม


Resampling

  • สุ่มตัวอย่างจากข้อมูลที่มีอยู่
  • ข้อมูลที่มีอยู่คือการแจกแจงความน่าจะเป็นโดยนัย
  • สมมติว่าข้อมูลมีความเป็นตัวแทนที่ดี
Monte Carlo Simulations ใน Python

วิธีการ resampling

  1. การสุ่มตัวอย่างแบบไม่ใส่คืน
    • ใช้สุ่มตัวอย่างแบบสุ่ม
  2. การสุ่มตัวอย่างแบบใส่คืน (หรือ bootstrapping)
    • ใช้ประมาณการแจกแจงของการสุ่มตัวอย่างสำหรับสถิติเกือบทุกชนิด
  3. Permutation
    • มักใช้เปรียบเทียบสองกลุ่ม
Monte Carlo Simulations ใน Python

การสุ่มตัวอย่างแบบไม่ใส่คืน

สุ่มเลือกรัฐที่แตกต่างกัน 2 รัฐจากทั้งหมด 6 รัฐในนิวอิงแลนด์

import random
def two_random_ne_states():

ne_states=["Maine", "Vermont", "New Hampshire", "Massachusetts", "Connecticut", "Rhode Island"]
return(random.sample(ne_states, 2))


two_random_ne_states()
['Massachusetts', 'Connecticut']
['New Hampshire', 'Maine']
Monte Carlo Simulations ใน Python

Bootstrapping

ประมาณช่วงความเชื่อมั่น 95% ของค่าเฉลี่ยส่วนสูงของนักบาสเกตบอล NBA

import random
import numpy as np

nba_heights = [196, 191, 198, 216, 188, 185, 211, 201,
               188, 191, 201, 208, 191, 183, 196]
simu_heights = []

for i in range(1000): bootstrap_sample = random.choices(nba_heights, k=15) simu_heights.append(np.mean(bootstrap_sample))
upper = np.quantile(simu_heights, 0.975) lower = np.quantile(simu_heights, 0.025) print([np.mean(simu_heights), lower, upper])
[196.26666666666668, 191.8, 201.2]
Monte Carlo Simulations ใน Python

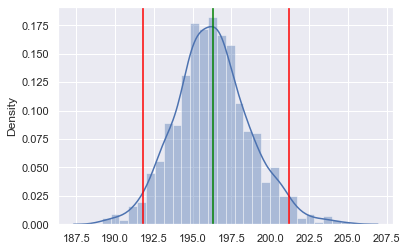
การแสดงผลของ bootstrap

ไลบรารีสำหรับการสร้างกราฟ:

  • seaborn
  • matplotlib
import seaborn as sns
import matplotlib.pyplot as plt

sns.displot(simu_heights)
plt.axvline(191.8, color="red")
plt.axvline(201.2, color="red")
plt.axvline(196.3, color="green")


กราฟการแจกแจงของส่วนสูงที่จำลองไว้

Monte Carlo Simulations ใน Python

Permutation

ประมาณช่วงความเชื่อมั่น 95% ของค่าเฉลี่ยความแตกต่างของส่วนสูงระหว่างนักบาสเกตบอล NBA กับชายอเมริกันทั่วไป

us_heights = [165, 185, 179, 187, 193, 180, 178, 179, 171, 176, 
              169, 160, 140, 199, 176, 185, 175, 196, 190, 176]
nba_heights = [196, 191, 198, 216, 188, 185, 211, 201, 188, 191, 201, 208, 191, 183, 196]

all_heights = us_heights + nba_heights
simu_diff = [] for i in range(1000): perm_sample = np.random.permutation(all_heights) perm_nba, perm_adult = perm_sample[0:15], perm_sample[15:35]
perm_diff = np.mean(perm_nba) - np.mean(perm_adult) simu_diff.append(perm_diff)
Monte Carlo Simulations ใน Python

ผลลัพธ์ของ permutation

ความแตกต่างของค่าเฉลี่ยส่วนสูงระหว่าง NBA กับชายอเมริกันทั่วไป:

np.mean(nba_heights) - np.mean(us_adult_height)
18.31666666666669

ช่วงความเชื่อมั่น 95% จากการสับเปลี่ยนรายการสุ่มสองรายการ:

upper = np.quantile(simu_diff, 0.975)
lower = np.quantile(simu_diff, 0.025)
print([lower, upper])
[-10.033333333333331, 10.033333333333331]
Monte Carlo Simulations ใน Python

การแสดงผลของ permutation

sns.distplot(simu_diff)
plt.axvline(-10.03, color="red")
plt.axvline(10.03, color="red")
plt.axvline(18.32, color="green")
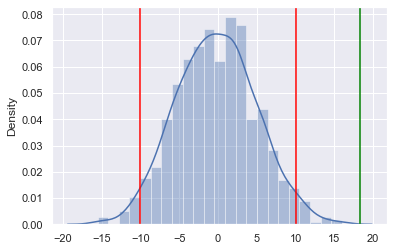
กราฟการแจกแจงของส่วนสูงที่จำลองไว้

Monte Carlo Simulations ใน Python

มาฝึกกันเถอะ!

Monte Carlo Simulations ใน Python

Preparing Video For Download...