การสร้างตัวแปรสุ่มแบบต่อเนื่อง
Monte Carlo Simulations ใน Python

Izzy Weber
Curriculum Manager, DataCamp
การแจกแจงแบบปกติ
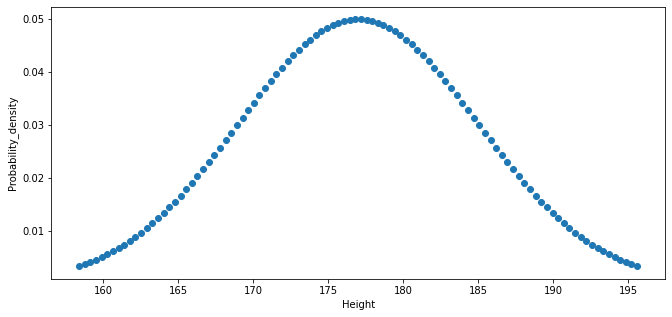
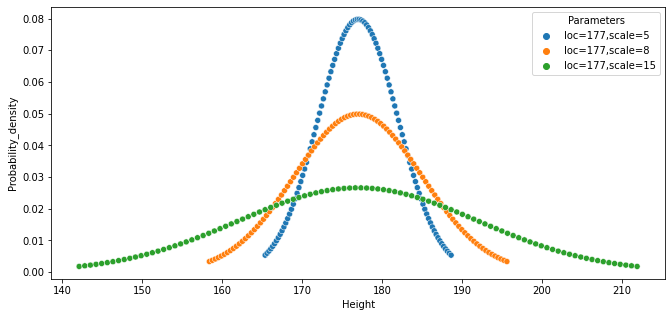
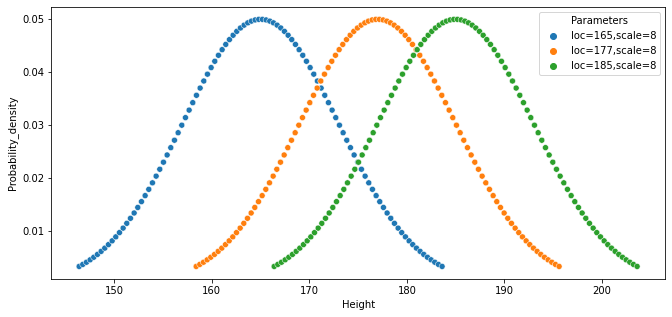
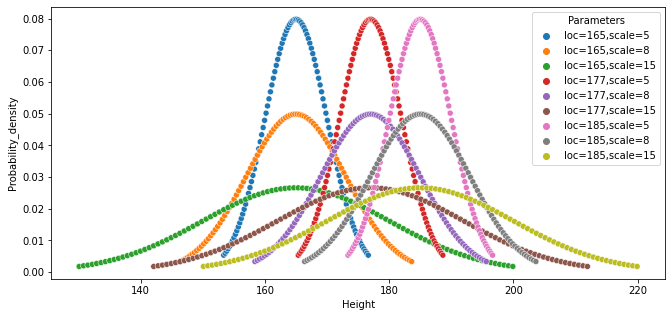
รูประฆังคว่ำ มีจุดศูนย์กลางที่ค่าเฉลี่ย (หรือ loc) และความกว้างกำหนดโดยส่วนเบี่ยงเบนมาตรฐาน (หรือ scale)
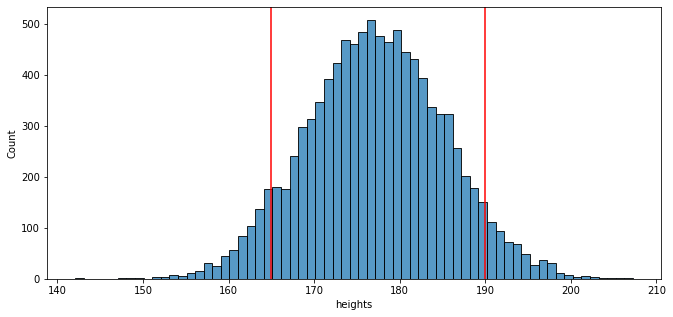
ความสูงของผู้ชายวัยผู้ใหญ่ชาวอเมริกันมีการแจกแจงแบบปกติ:
การเปลี่ยน scale (ส่วนเบี่ยงเบนมาตรฐาน)
การเปลี่ยน loc (ค่าเฉลี่ย)
การเปลี่ยนทั้ง scale และ loc
การพล็อตผลลัพธ์จากการจำลอง
heights_dict = {"heights":heights}
sns.histplot(x="heights", data=heights_dict)
plt.axvline(x=165, color="red")
plt.axvline(x=190, color="red")