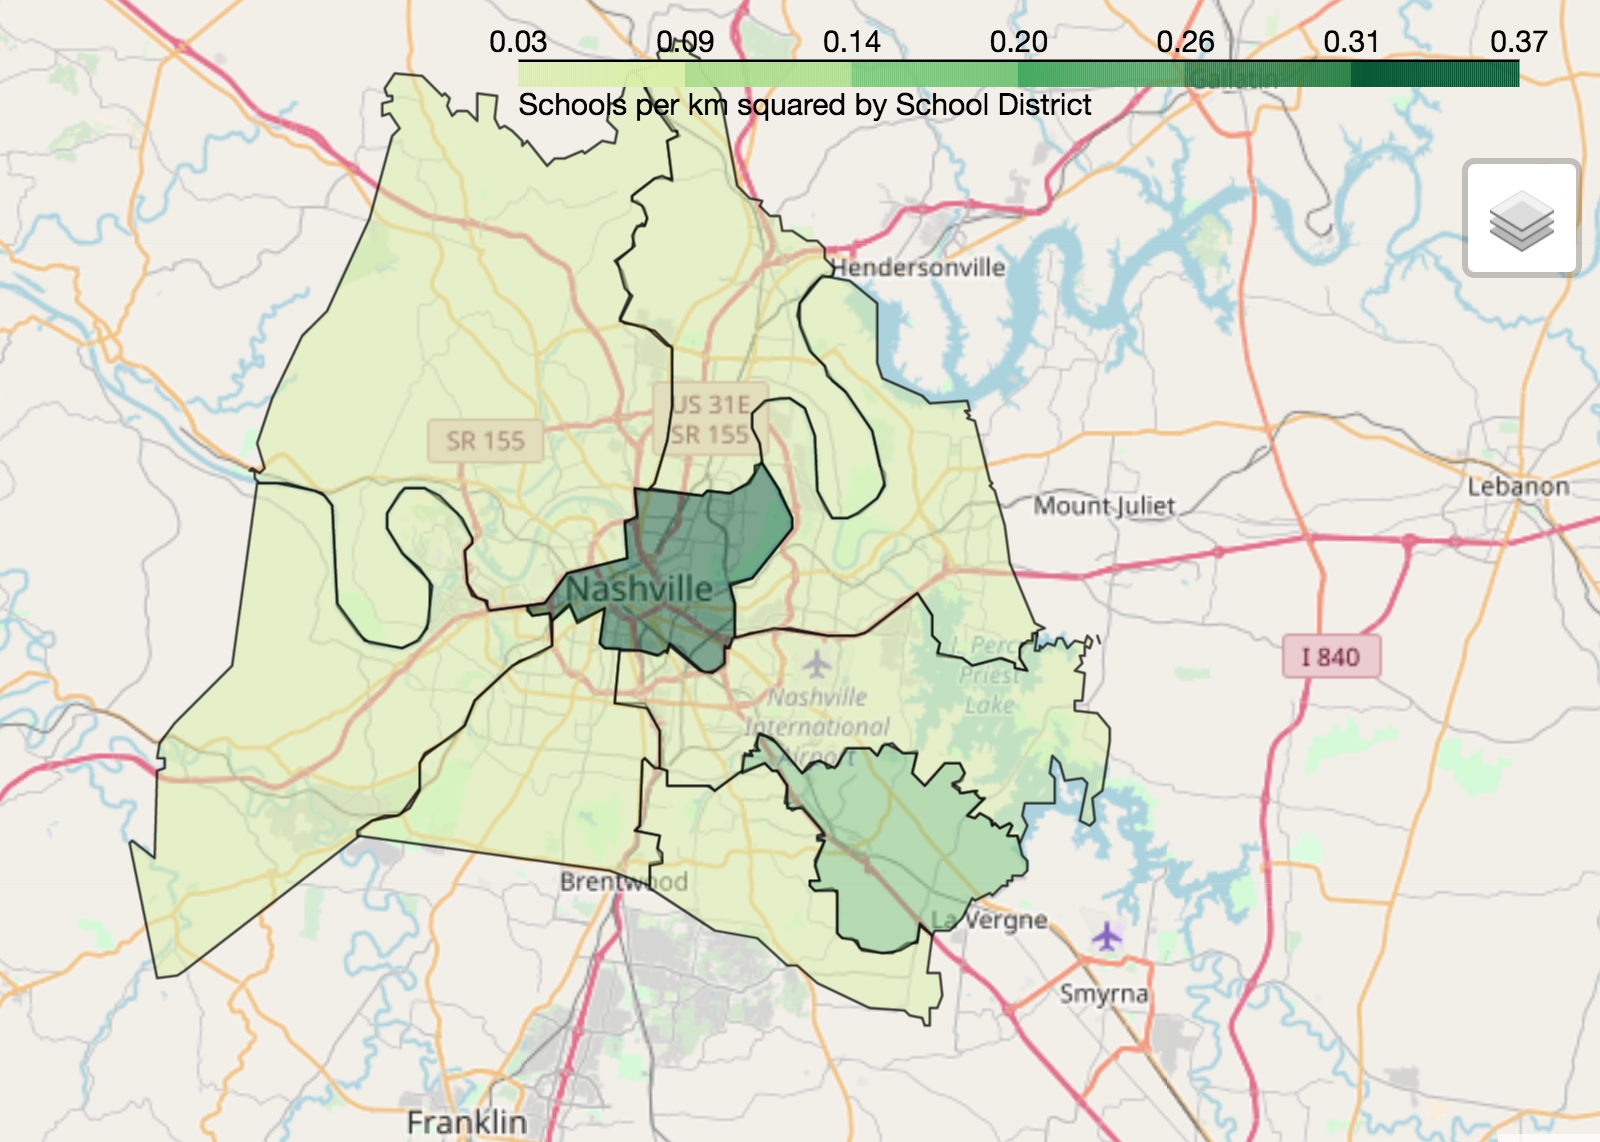
การแสดงผลข้อมูลเชิงภูมิศาสตร์ด้วย Python
Mary van Valkenburg
Data Science Program Manager, Nashville Software School
# Construct a map object for Nashville
nashville = [36.1636,-86.7823]
m = folium.Map(location=nashville, zoom_start=10)
# Create a choropleth using the folium Choropleth class
folium.Choropleth(...)
geo_data - ข้อมูลต้นทางของ polygon (ไฟล์ GeoJSON หรือ GeoDataFrame)name - ชื่อคอลัมน์ geometry (หรือ property ใน GeoJSON) ของ polygondata - DataFrame หรือ Series ที่ใช้เป็นข้อมูลสำหรับ normalizecolumns - รายการคอลัมน์: คอลัมน์ที่ตรงกับ polygon และคอลัมน์ที่มีค่าที่ต้องการแสดงkey_on - ตัวแปร GeoJSON สำหรับผูกข้อมูล (ขึ้นต้นด้วย feature เสมอ)fill_color - สีพื้น polygon (ค่าเริ่มต้นคือสีน้ำเงิน) fill_opacity - ค่าความโปร่งใส ระหว่าง 0 (โปร่งใส) ถึง 1 (ทึบสนิท)line_color - สีเส้นขอบ polygon (ค่าเริ่มต้นคือสีดำ)line_opacity - ค่าความโปร่งใส ระหว่าง 0 (โปร่งใส) ถึง 1 (ทึบสนิท) legend_name - กำหนดชื่อหัวข้อสำหรับ legend# Center point and map for Nashville
nashville = [36.1636,-86.7823]
m = folium.Map(location=nashville, zoom_start=10)
# Define a choropleth layer for the map
folium.Choropleth(
geo_data=districts_with_counts,
name='geometry',
data=districts_with_counts,
columns=['district', 'school_density'],
key_on='feature.properties.district',
fill_color='YlGn',
fill_opacity=0.75,
line_opacity=0.5,
legend_name='Schools per km squared by School District'
).add_to(m)
folium.LayerControl().add_to_map()
display(m)

การแสดงผลข้อมูลเชิงภูมิศาสตร์ด้วย Python