Choropleth คืออะไร?

การแสดงผลข้อมูลเชิงภูมิศาสตร์ด้วย Python

Mary van Valkenburg

Data Science Program Manager, Nashville Software School

นิยามของ choropleth
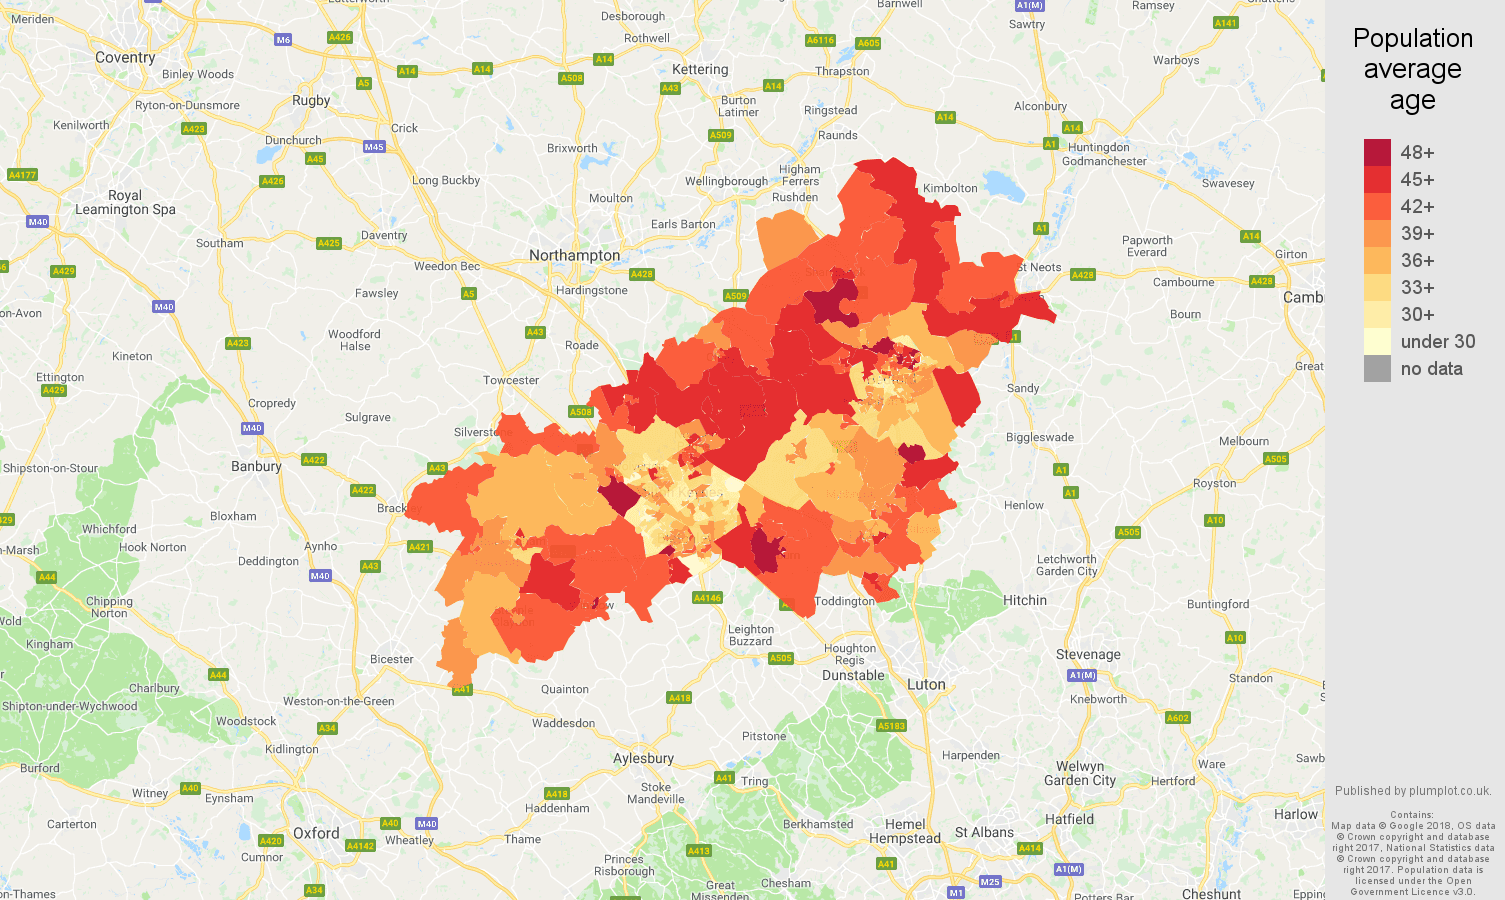
choropleth แสดงอายุเฉลี่ยของผู้อยู่อาศัยใน LSOA ของ Milton Keynes

การแสดงผลข้อมูลเชิงภูมิศาสตร์ด้วย Python

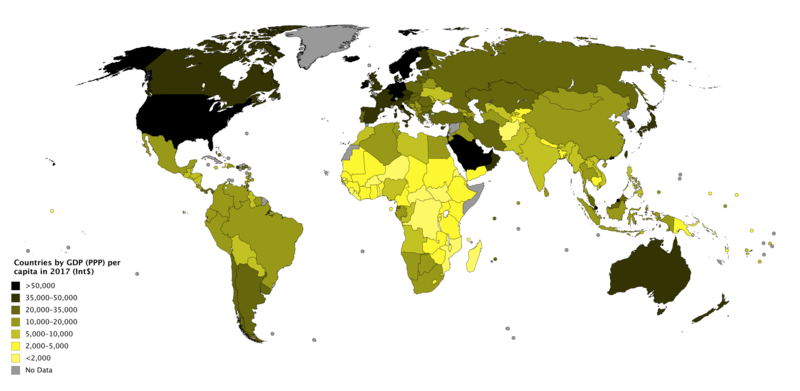
choropleth แสดง GDP ต่อหัวของโลกแบบ PPP

การแสดงผลข้อมูลเชิงภูมิศาสตร์ด้วย Python

ความหนาแน่น

schools_in_districts.head(2)
district  geometry                  name               lat    lng
1         (POLYGON ((-86.77 36.38... Nashville Prep    36.16 -86.85
1         (POLYGON ((-86.77 36.38... Rocketship Prep   36.17 -86.79
การแสดงผลข้อมูลเชิงภูมิศาสตร์ด้วย Python

นับจำนวน

school_counts = schools_in_districts.groupby(['district']).size()
print(school_counts)
district
1    30
2    11
3    19
4    18
5    36
6    21
7    13
8    10
9    12
dtype: int64
การแสดงผลข้อมูลเชิงภูมิศาสตร์ด้วย Python

เพิ่มจำนวนนับ

school_counts_df = school_counts.to_frame()
school_counts_df = school_counts_df.reset_index()
school_counts_df.columns = ['district', 'school_count']
districts_with_counts = pd.merge(school_districts, school_counts_df, 
                                 on = 'district')
districts_with_counts.head(2)
district geometry           school_count
1        (POLYGON ((-86.77 36.38...  30
3        (POLYGON ((-86.75 36.40...  19
การแสดงผลข้อมูลเชิงภูมิศาสตร์ด้วย Python

หารจำนวนนับด้วยพื้นที่

districts_with_counts['area'] = districts_with_counts.area
districts_with_counts['school_density'] = districts_with_counts.apply(
    lambda row: row.school_count/row.area, axis = 1)

districts_with_counts.head(2)
district geometry           school_count   area    school_density
1        (POLYGON ((-86.77 36.38...    30    0.036641    818.745403
3        (POLYGON ((-86.75 36.40...    19    0.014205    1337.594495
การแสดงผลข้อมูลเชิงภูมิศาสตร์ด้วย Python

มาฝึกกันเถอะ!

การแสดงผลข้อมูลเชิงภูมิศาสตร์ด้วย Python

Preparing Video For Download...