เพิ่มเติมเกี่ยวกับ resamples

Machine Learning ด้วย caret ใน R

Zach Mayer

Data Scientist at DataRobot and co-author of caret

การเปรียบเทียบโมเดล

  • resamples มีเมธอดที่มีประโยชน์มากมาย
  • หนึ่งในฟังก์ชันโปรด (ขอบคุณ Max!)
  • เป็นแรงบันดาลใจให้กับแพ็กเกจ caretEnsemble
Machine Learning ด้วย caret ใน R

Box-and-whisker

bwplot(resamps, metric = "ROC")
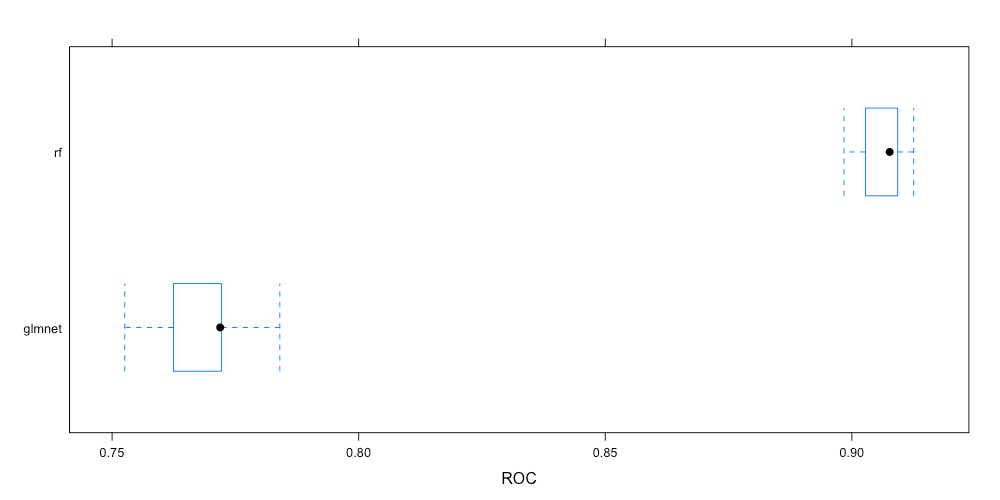
ภาพแสดง box and whisker plot ของ resamples โดย ROC ของโมเดล random forest สูงกว่าโมเดล glmnet อย่างชัดเจน

Machine Learning ด้วย caret ใน R

Dot plot

dotplot(resamps, metric = "ROC")
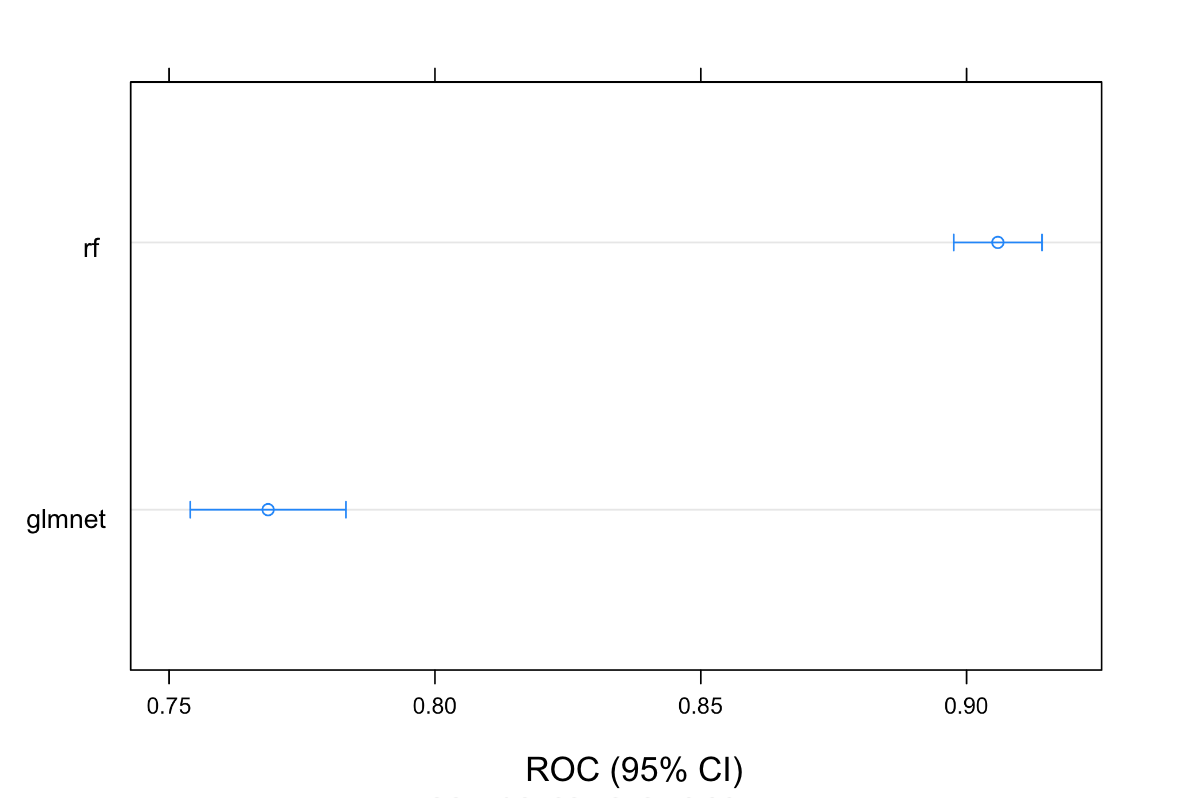
ภาพแสดง dotplot ของ resamples แสดงค่าเฉลี่ยและช่วงความเชื่อมั่นของ ROC สำหรับแต่ละโมเดล

Machine Learning ด้วย caret ใน R

Density plot

densityplot(resamps, metric = "ROC")
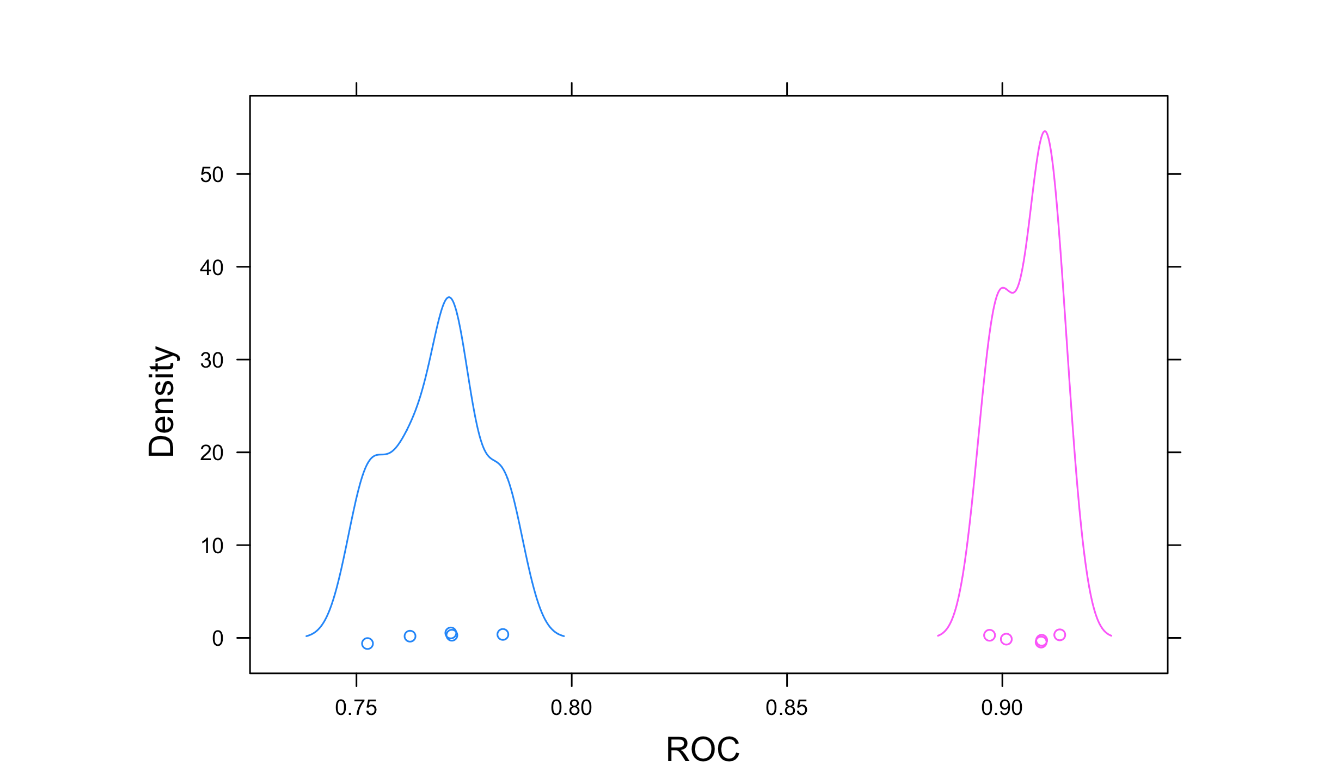
ภาพแสดงเส้นโค้งความหนาแน่นของ ROC สำหรับ resamples ของแต่ละโมเดล

Machine Learning ด้วย caret ใน R

Scatter plot

xyplot(resamps, metric = "ROC")
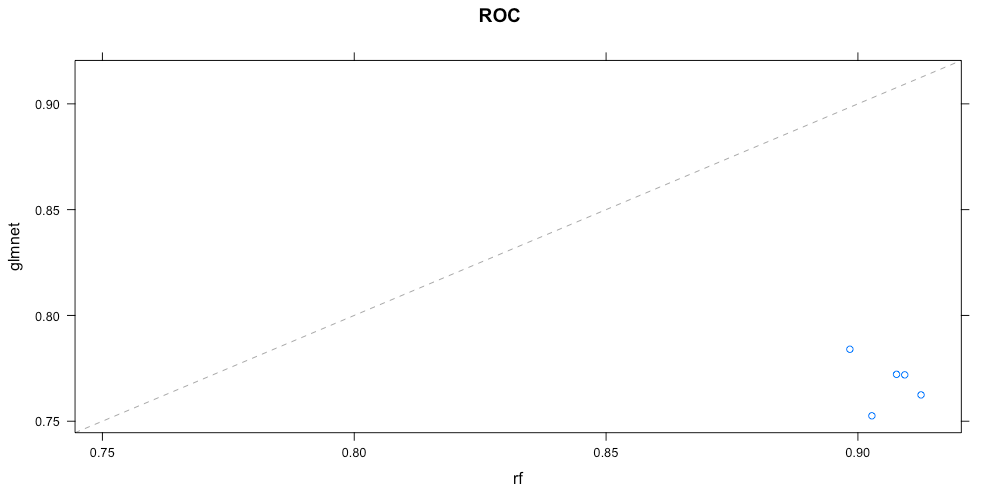
ภาพแสดง scatter plot ของคะแนน AUC ระหว่าง glmnet กับ random forest โดยแต่ละจุดแทน resample หนึ่งครั้ง

Machine Learning ด้วย caret ใน R

Dot plot อีกแบบ

dotplot(lots_of_models, metric = "ROC")
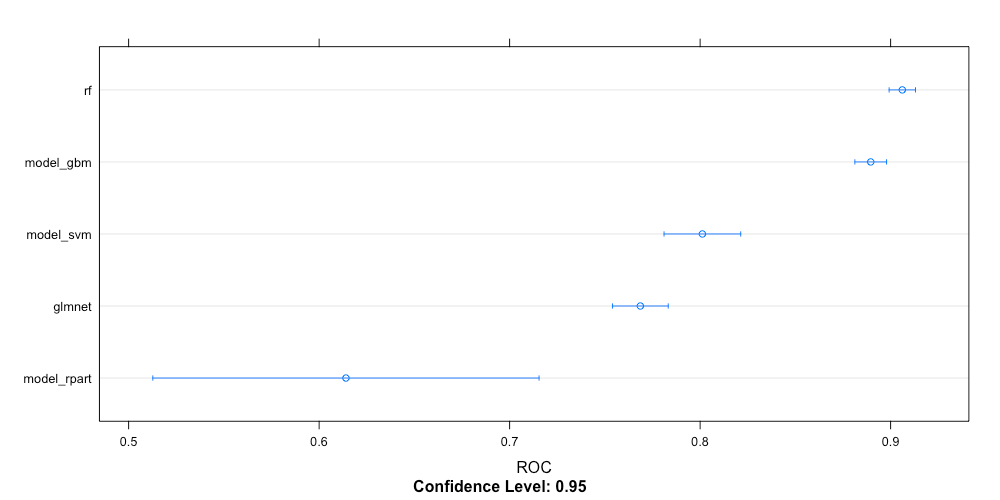
ภาพแสดง dotplot ของประเภทโมเดลเทียบกับ ROC แสดงให้เห็นว่า dotplot รองรับการแสดงผลโมเดลหลายประเภทได้ดี

Machine Learning ด้วย caret ใน R

มาฝึกกันเถอะ!

Machine Learning ด้วย caret ใน R

Preparing Video For Download...