แนะนำ ROC curve

Machine Learning ด้วย caret ใน R

Zach Mayer

Data Scientist at DataRobot and co-author of caret

ความท้าทาย

  • มี threshold สำหรับการจำแนกประเภทได้หลายค่า
  • ต้องเลือก threshold เองด้วยตนเอง
  • อาจมองข้าม threshold บางค่าได้ง่าย
  • จำเป็นต้องมีแนวทางที่เป็นระบบมากขึ้น
Machine Learning ด้วย caret ใน R

ROC curves

  • พล็อต true/false positive rate ที่ทุก threshold ที่เป็นไปได้
  • แสดงภาพ tradeoff ระหว่างสองขั้วสุด (true positive 100% เทียบกับ false positive 0%)
  • ผลลัพธ์ที่ได้คือ ROC curve
  • พัฒนาขึ้นครั้งแรกเพื่อวิเคราะห์สัญญาณเรดาร์
Machine Learning ด้วย caret ใน R

ตัวอย่าง ROC curve

# Create ROC curve
library(caTools)
colAUC(p, test[["Class"]], plotROC = TRUE)
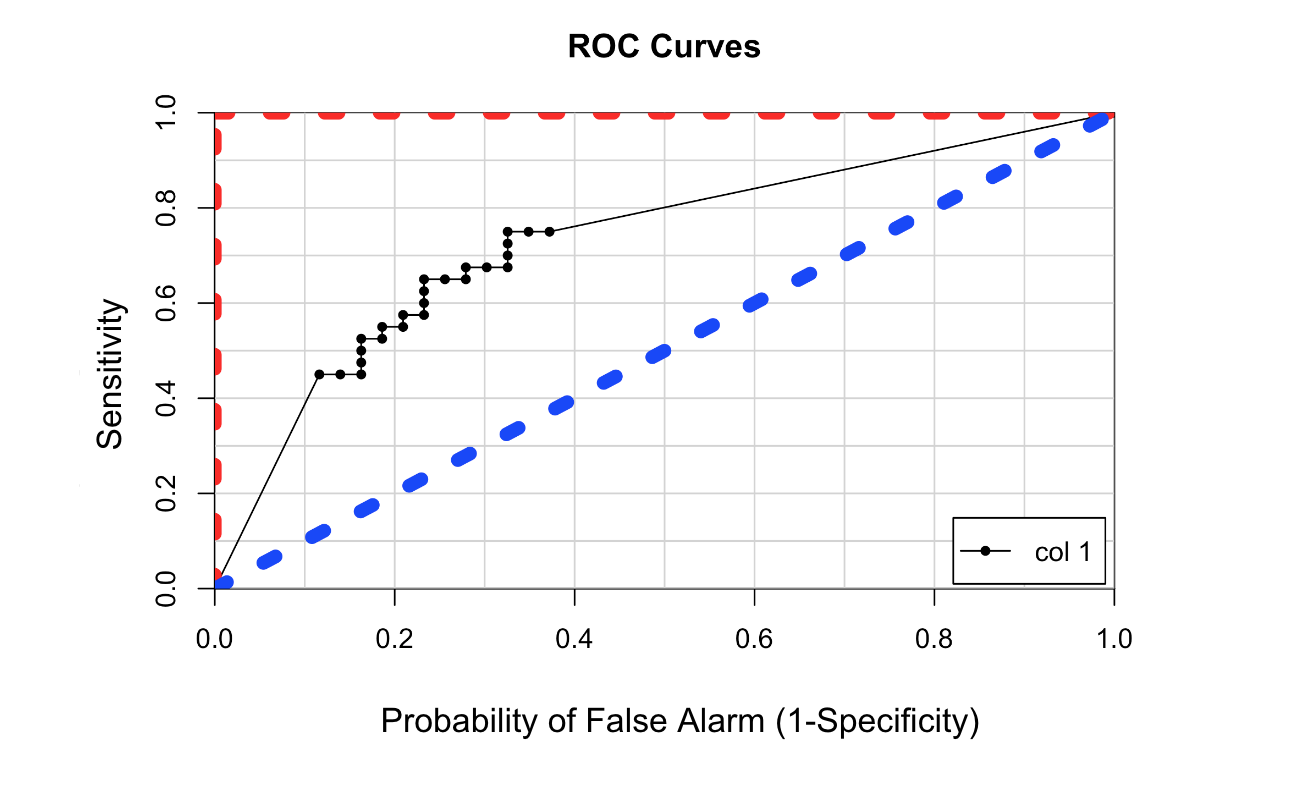
ภาพแสดงตัวอย่าง ROC curve ในรูปแบบกราฟเส้นของ true positive rate เทียบกับ false positive rate

Machine Learning ด้วย caret ใน R

มาฝึกกันเถอะ!

Machine Learning ด้วย caret ใน R

Preparing Video For Download...