การลดมิติข้อมูล: เทคนิคการแสดงผล

ฝึกตอบคำถามสัมภาษณ์ Machine Learning ด้วย Python

Lisa Stuart

Data Scientist

ทำไมต้องลดมิติข้อมูล?

  1. เร่งความเร็วการฝึกโมเดล ML
  2. การแสดงผลข้อมูล
  3. เพิ่มความแม่นยำ
ฝึกตอบคำถามสัมภาษณ์ Machine Learning ด้วย Python

เทคนิคการแสดงผลข้อมูล

  • PCA
  • t-SNE
ฝึกตอบคำถามสัมภาษณ์ Machine Learning ด้วย Python

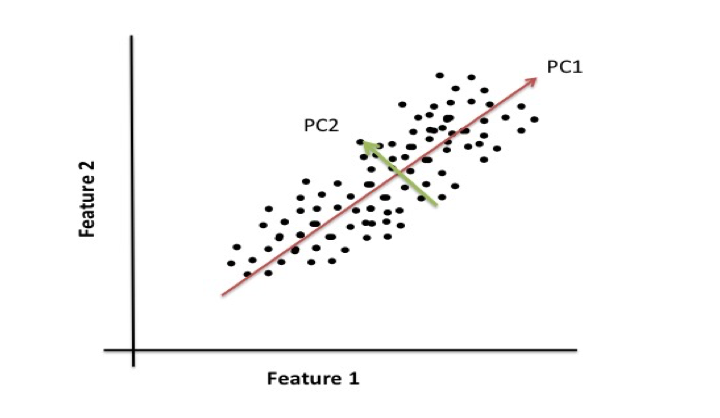
การแสดงผลด้วย PCA

กราฟ PCA

1 https://districtdatalabs.silvrback.com/principal-component-analysis-with-python
ฝึกตอบคำถามสัมภาษณ์ Machine Learning ด้วย Python

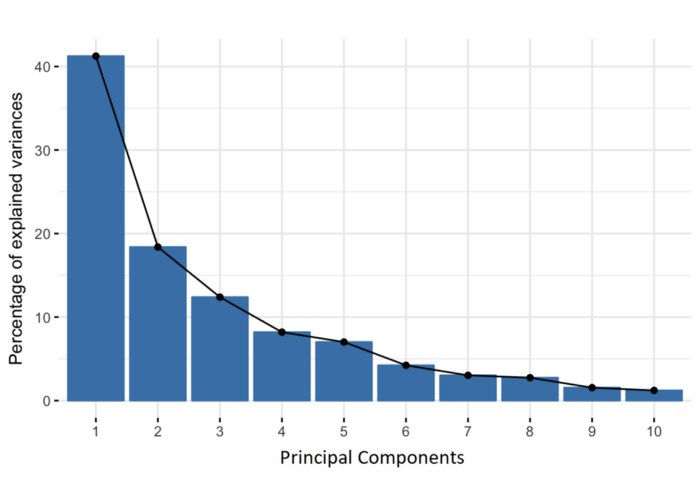
Scree plot

Scree plot

1 https://towardsdatascience.com/a-step-by-step-explanation-of-principal-component-analysis-b836fb9c97e2
ฝึกตอบคำถามสัมภาษณ์ Machine Learning ด้วย Python

t-SNE

  • เชิงความน่าจะเป็น
  • คู่ของจุดข้อมูล
  • การฝังในมิติต่ำ
  • พล็อตค่า embedding
ฝึกตอบคำถามสัมภาษณ์ Machine Learning ด้วย Python

การแสดงผลด้วย t-SNE

# t-sne with loan data
from sklearn.manifold import TSNE
import seaborn as sns

loans =  pd.read_csv('loans_dataset.csv')

# Feature matrix
X = loans.drop('Loan Status', axis=1)

tsne = TSNE(n_components=2, verbose=1, perplexity=40)
tsne_results = tsne.fit_transform(X)

loans['t-SNE-PC-one'] = tsne_results[:,0]
loans['t-SNE-PC-two'] = tsne_results[:,1]

# t-sne viz
plt.figure(figsize=(16,10))
sns.scatterplot(
    x="t-SNE-PC-one", y="t-SNE-PC-two",
    hue="Loan Status",
    palette=sns.color_palette(["grey","blue"]),
    data=loans,
    legend="full",
    alpha=0.3
)
1 https://scikit-learn.org/stable/modules/generated/sklearn.manifold.TSNE.html
ฝึกตอบคำถามสัมภาษณ์ Machine Learning ด้วย Python

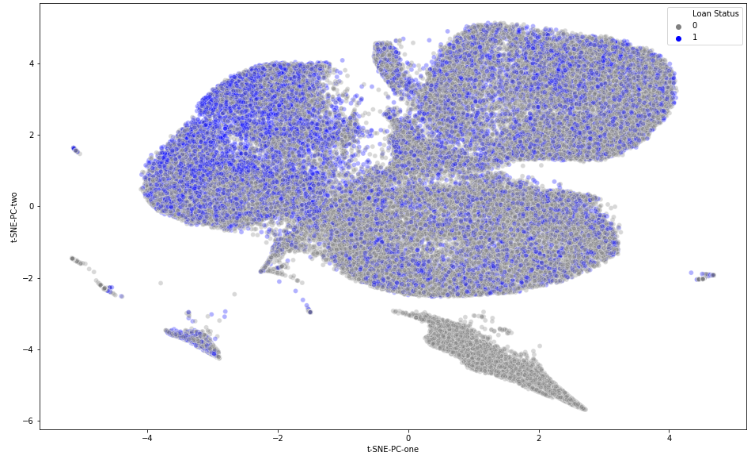
การแสดงผลด้วย t-SNE

กราฟ t-SNE

ฝึกตอบคำถามสัมภาษณ์ Machine Learning ด้วย Python

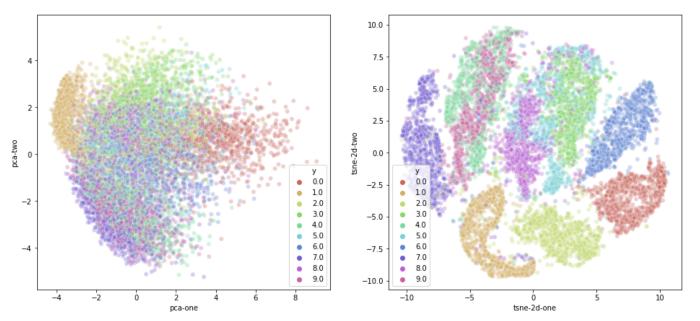
PCA vs t-SNE บนข้อมูล digits

PCA และ t-SNE บนชุดข้อมูล digits

1 https://towardsdatascience.com/visualising-high-dimensional-datasets-using-pca-and-t-sne-in-python-8ef87e7915b
ฝึกตอบคำถามสัมภาษณ์ Machine Learning ด้วย Python

มาฝึกกันเถอะ!

ฝึกตอบคำถามสัมภาษณ์ Machine Learning ด้วย Python

Preparing Video For Download...