Plotta direkt med pandas
Python för R-användare

Daniel Chen
Instructor
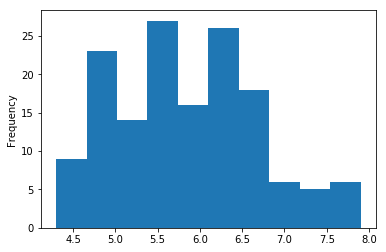
Univariat: Histogram
import matplotlib.pyplot as plt
iris['sepal_length'].plot(kind='hist')
plt.show()
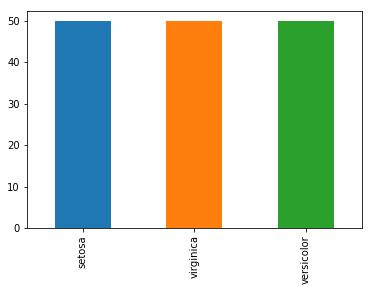
Univariat: Stapeldiagram
cts = iris['species'].value_counts()
cts.plot(kind='bar')
plt.show()
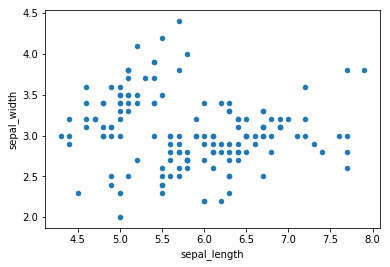
Bivariat: Spridningsdiagram
iris.plot(kind='scatter', x='Sepal.Length', y='Sepal.Width')
plt.show()
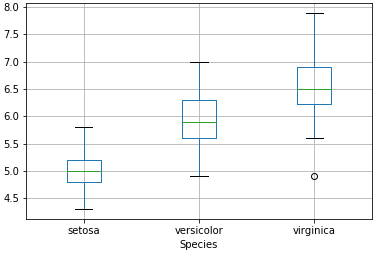
Bivariat: Boxplottar
iris.plot(kind='box')
plt.show()
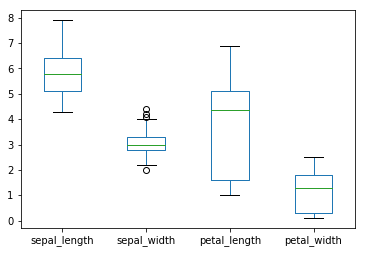
Bivariat: Boxplottar
iris.boxplot(by='Species', column='Sepal.Length')
plt.show()