Matplotlib
Python สำหรับผู้ใช้ R

Daniel Chen
Instructor
กราฟ Matplotlib
import matplotlib.pyplot as plt
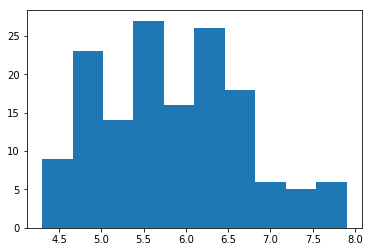
plt.hist(iris['sepal_length'])
plt.show()
Scatter plot ใน Matplotlib
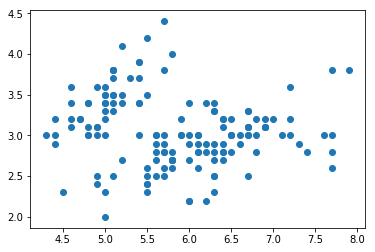
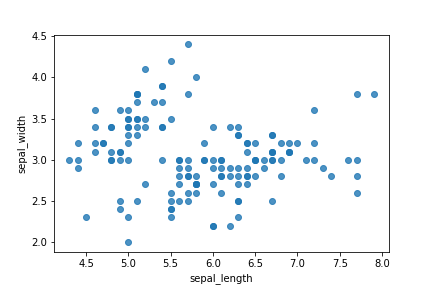
plt.scatter(iris['sepal_length'], iris['sepal_width'])
plt.show()
ปรับแต่งกราฟให้สมบูรณ์
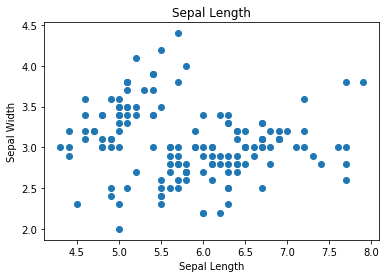
fig, ax = plt.subplots()
ax.scatter(iris['sepal_length'], iris['sepal_width'])
ax.set_title('Sepal Length')
ax.set_xlabel('Sepal Length')
ax.set_ylabel('Sepal Width')
plt.show()
หมุน tick บนแกน
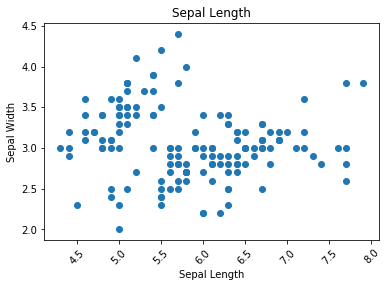
fig, ax = plt.subplots()
ax.scatter(iris['sepal_length'], iris['sepal_width'])
ax.set_title('Sepal Length')
ax.set_xlabel('Sepal Length')
ax.set_ylabel('Sepal Width')
plt.xticks(rotation=45) # rotate the x-axis ticks
plt.show()
ส่วนประกอบของ figure ใน Matplotlib
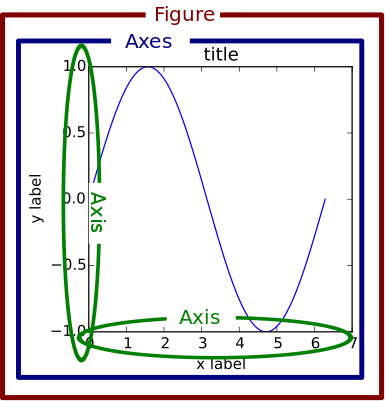
ส่วนประกอบของ figure ใน Matplotlib 2
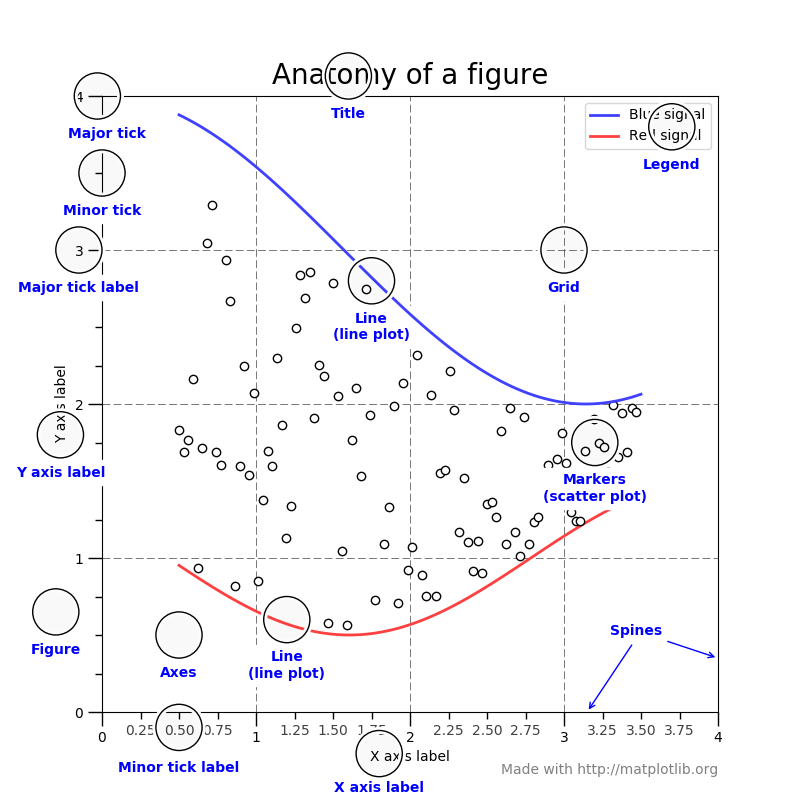
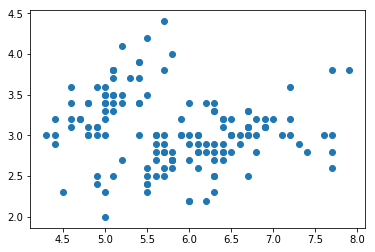
Figure และ Axes
fig, ax = plt.subplots()
ax.scatter(iris['sepal_length'], iris['sepal_width'])
plt.show()
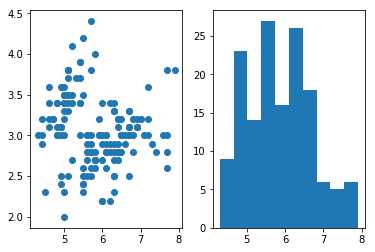
หลาย Axes
fig, (ax1, ax2) = plt.subplots(1, 2)
ax1.scatter(iris['sepal_length'], iris['sepal_width'])
ax2.hist(iris['sepal_length'])
plt.show()
จำไว้
fig, ax = plt.subplots()
sns.regplot(x='sepal_length', y='sepal_width',
            data=iris, fit_reg=False, ax=ax)
plt.show()
ล้าง figure
fig, (ax1, ax2) = plt.subplots(1, 2)
ax1.scatter(iris['sepal_length'], iris['sepal_width'])
ax2.hist(iris['sepal_length'])
plt.show()
plt.clf()

