การพล็อตกราฟด้วย pandas โดยตรง

Python สำหรับผู้ใช้ R

Daniel Chen

Instructor

การพล็อตกราฟใน Python

  • แสดงรูปแบบของข้อมูลได้อย่างรวดเร็ว
  • วิธีพล็อตกราฟใน Python:
    • pandas
    • Seaborn
    • Matplotlib
Python สำหรับผู้ใช้ R

เมธอด plot ของ pandas

  • เมธอด plot()
  • ใช้งานได้กับออบเจกต์ DataFrame และ Series ของ pandas
  • ระบุอาร์กิวเมนต์ kind ให้กับ plot
  • ประเภทของกราฟ (kind):
    • line : กราฟเส้น (ค่าเริ่มต้น)
    • bar : กราฟแท่งแนวตั้ง
    • barh : กราฟแท่งแนวนอน
  • hist : ฮิสโตแกรม
  • box : boxplot
  • kde : กราฟ Kernel Density Estimation
  • density : เหมือนกับ 'kde'
  • area : กราฟพื้นที่
  • pie : กราฟวงกลม
  • scatter : กราฟกระจาย
  • hexbin : hexbin plot
Python สำหรับผู้ใช้ R

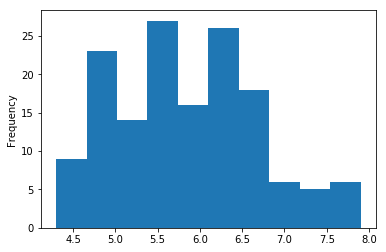
ตัวแปรเดียว: ฮิสโตแกรม

import matplotlib.pyplot as plt
iris['sepal_length'].plot(kind='hist')
plt.show()
Python สำหรับผู้ใช้ R

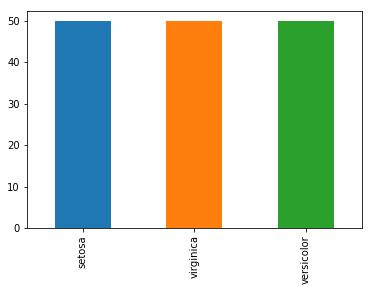
ตัวแปรเดียว: กราฟแท่ง

cts = iris['species'].value_counts()
cts.plot(kind='bar')
plt.show()
Python สำหรับผู้ใช้ R

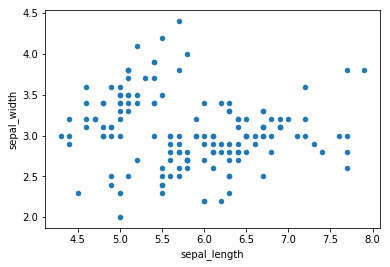
สองตัวแปร: กราฟกระจาย

iris.plot(kind='scatter', x='Sepal.Length', y='Sepal.Width')
plt.show()
Python สำหรับผู้ใช้ R

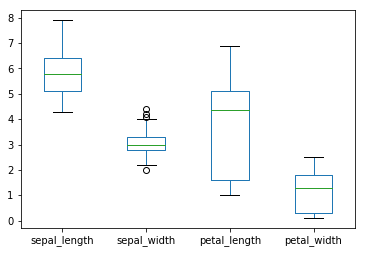
สองตัวแปร: Boxplot

iris.plot(kind='box')
plt.show()
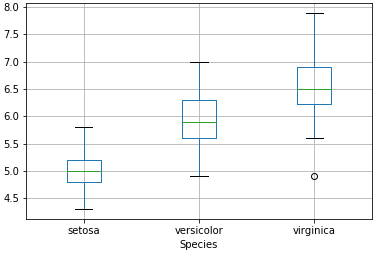
Python สำหรับผู้ใช้ R

สองตัวแปร: Boxplot

iris.boxplot(by='Species', column='Sepal.Length')
plt.show()
Python สำหรับผู้ใช้ R

มาฝึกกันเถอะ!

Python สำหรับผู้ใช้ R

Preparing Video For Download...