การพล็อต Poisson regression

Generalized Linear Models ใน R

Richard Erickson

Instructor

เมื่อไรควรใช้ geom_smooth กับ Poisson

  • เหมาะสมที่สุดกับตัวแปรพยากรณ์แบบต่อเนื่อง
  • เช่น ปริมาณยาที่เพิ่มขึ้นและจำนวนเซลล์มะเร็งต่อ cm$^2$
  • หากไม่เช่นนั้น ให้ใช้ boxplot หรือเครื่องมือพล็อตที่คล้ายกัน
Generalized Linear Models ใน R

การศึกษาเซลล์มะเร็งตามปริมาณยา

  • จำลองข้อมูล
  • Dose-response
    • x: ปริมาณยา (Dose)
    • y: จำนวนเซลล์มะเร็งต่อ cm$^2$
Generalized Linear Models ใน R

พล็อตจุด

ggplot(data = dat, aes(x = dose, y = cells)) +
    geom_point()
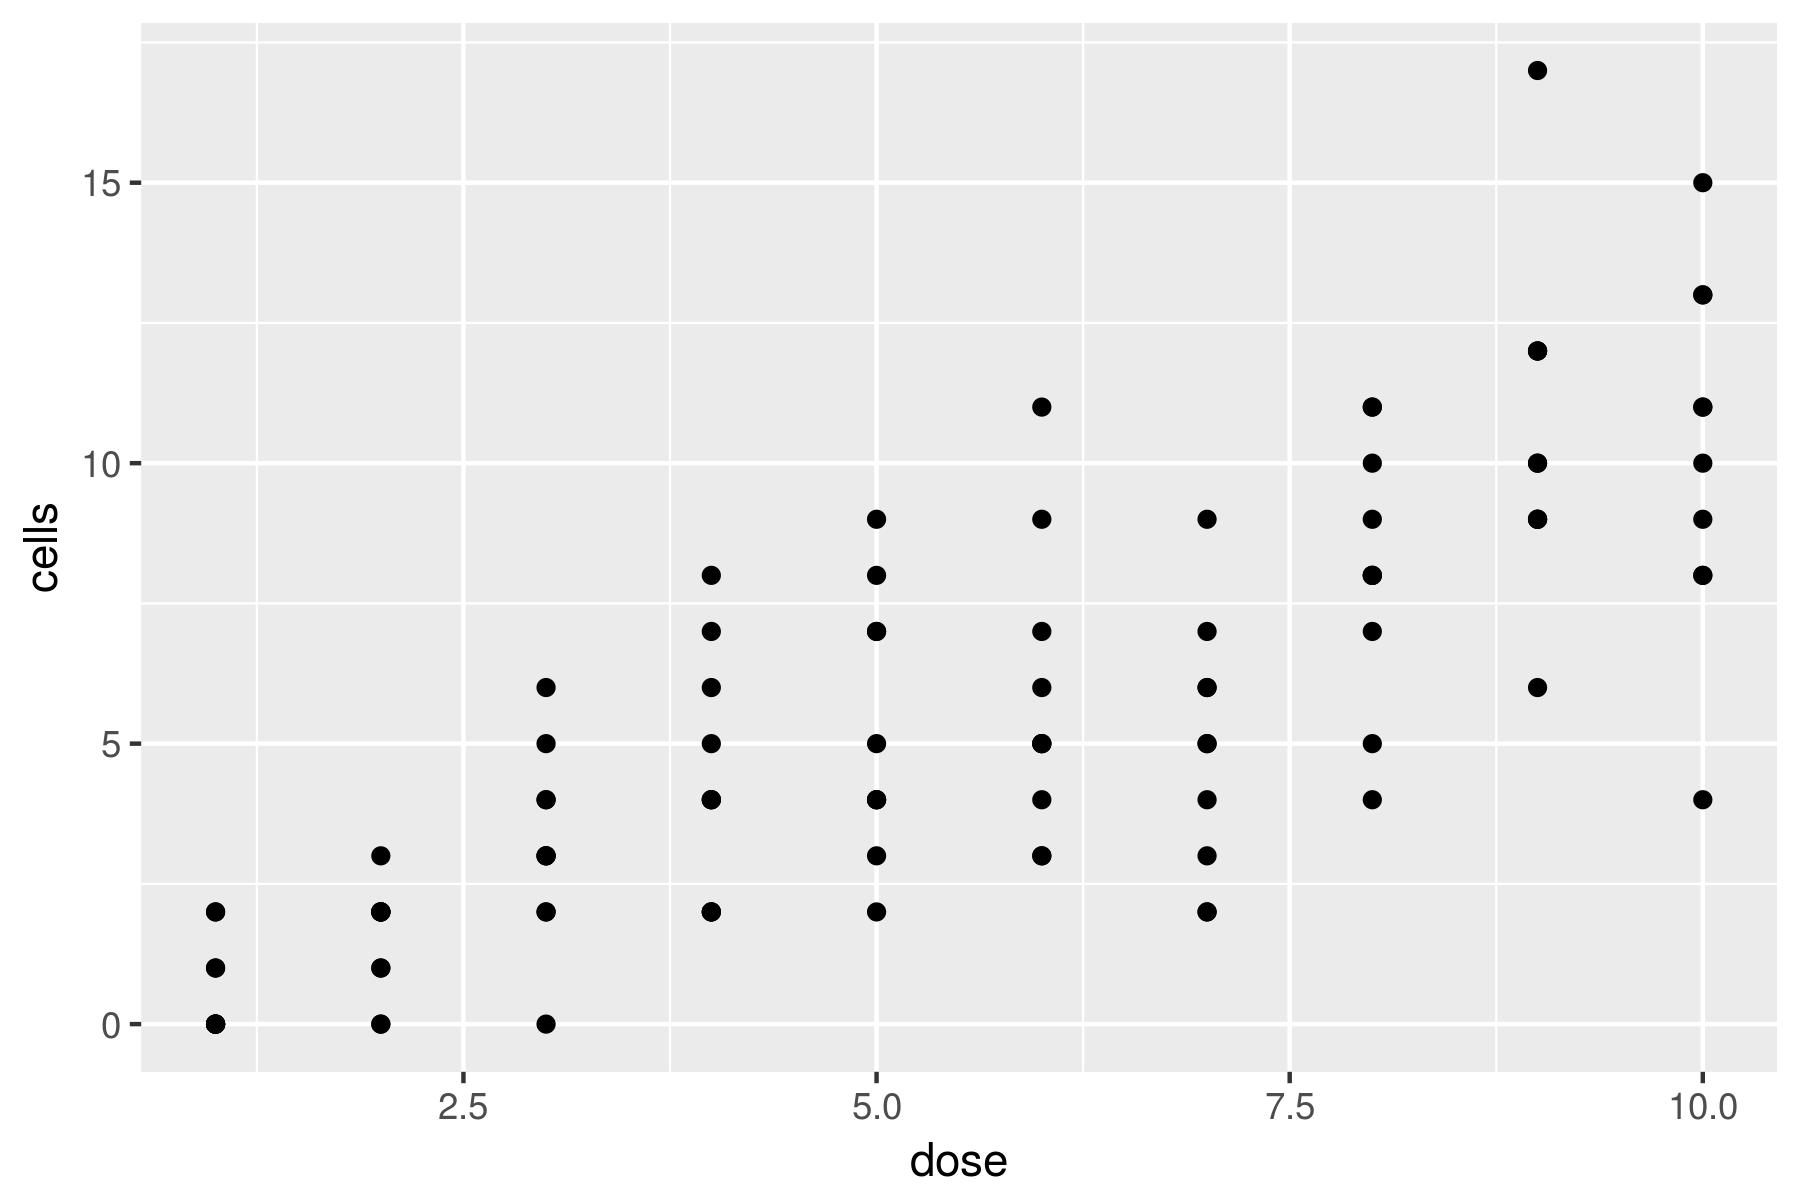
ggplot แบบจุด

Generalized Linear Models ใน R

Jitter จุด

ggplot(data = dat, aes(x = dose, y = cells)) +
   geom_jitter(width = 0.05, height = 0.05)
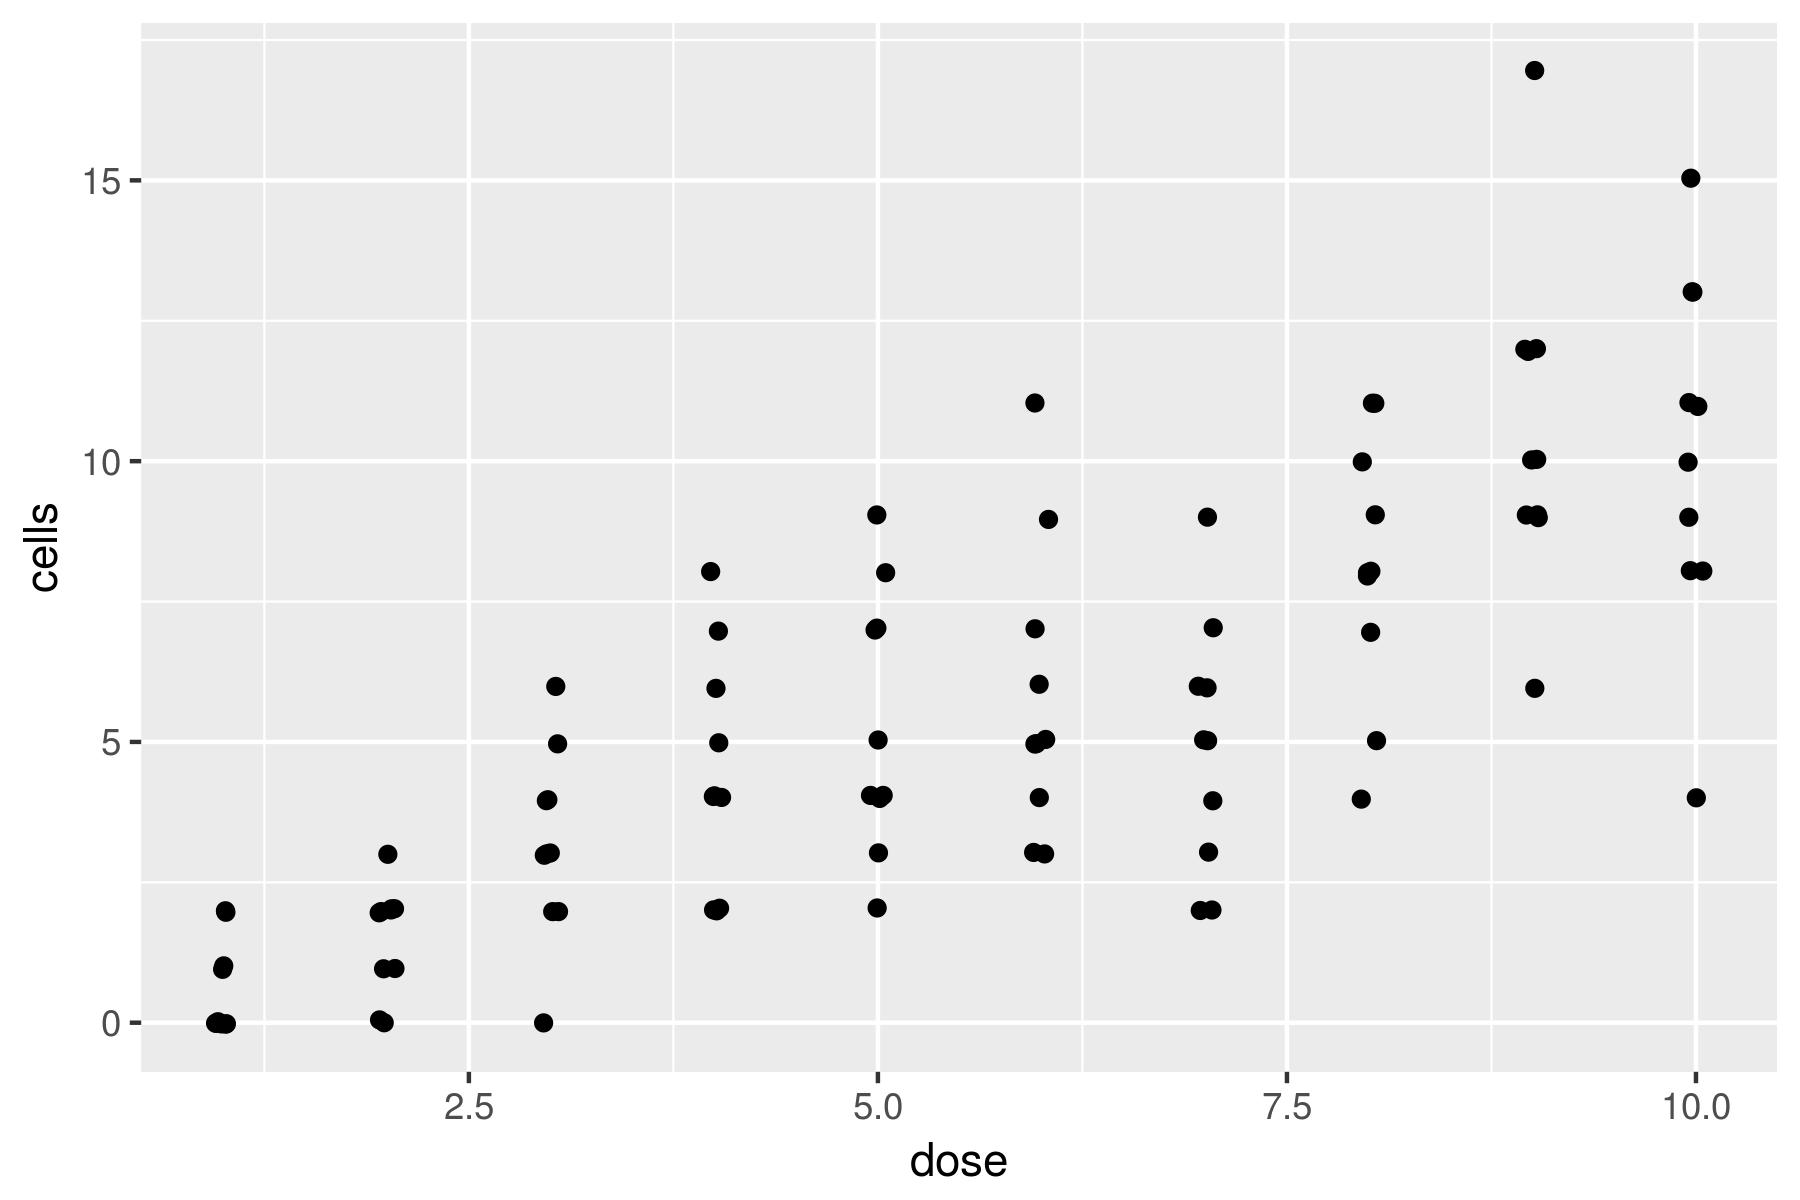
ตัวอย่างจุด jitter ด้วย ggplot2

Generalized Linear Models ใน R

geom_smooth()

ggplot(data = dat, aes(x = dose, y = cells)) +
   geom_jitter(width = 0.05, height = 0.05)
   geom_smooth()
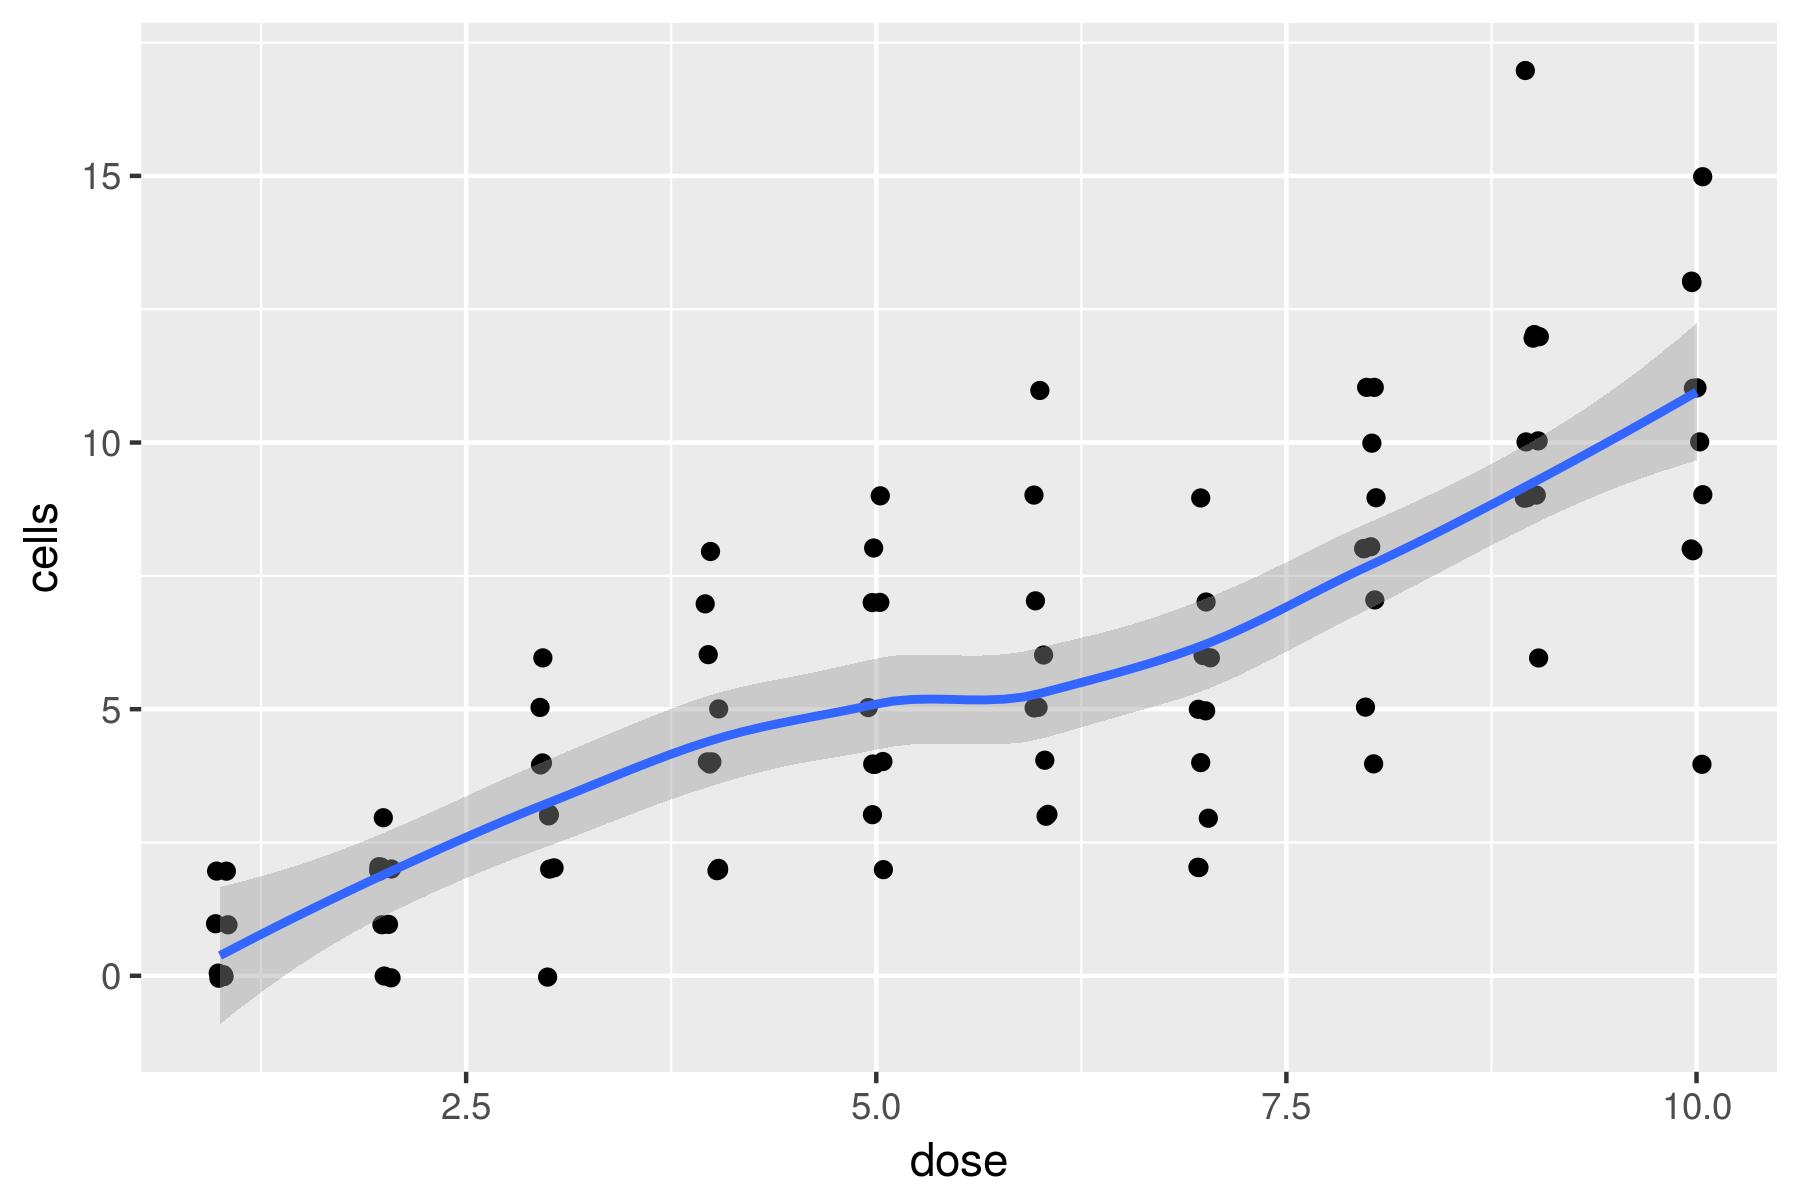
ตัวอย่าง geom_smooth() แบบค่าเริ่มต้นบนจุด jitter

Generalized Linear Models ใน R

GLM ด้วย geom_smooth()

ggplot(data = dat, aes(x = dose, y = cells)) +
   geom_jitter(width = 0.05, height = 0.05)
   geom_smooth(method = 'glm')
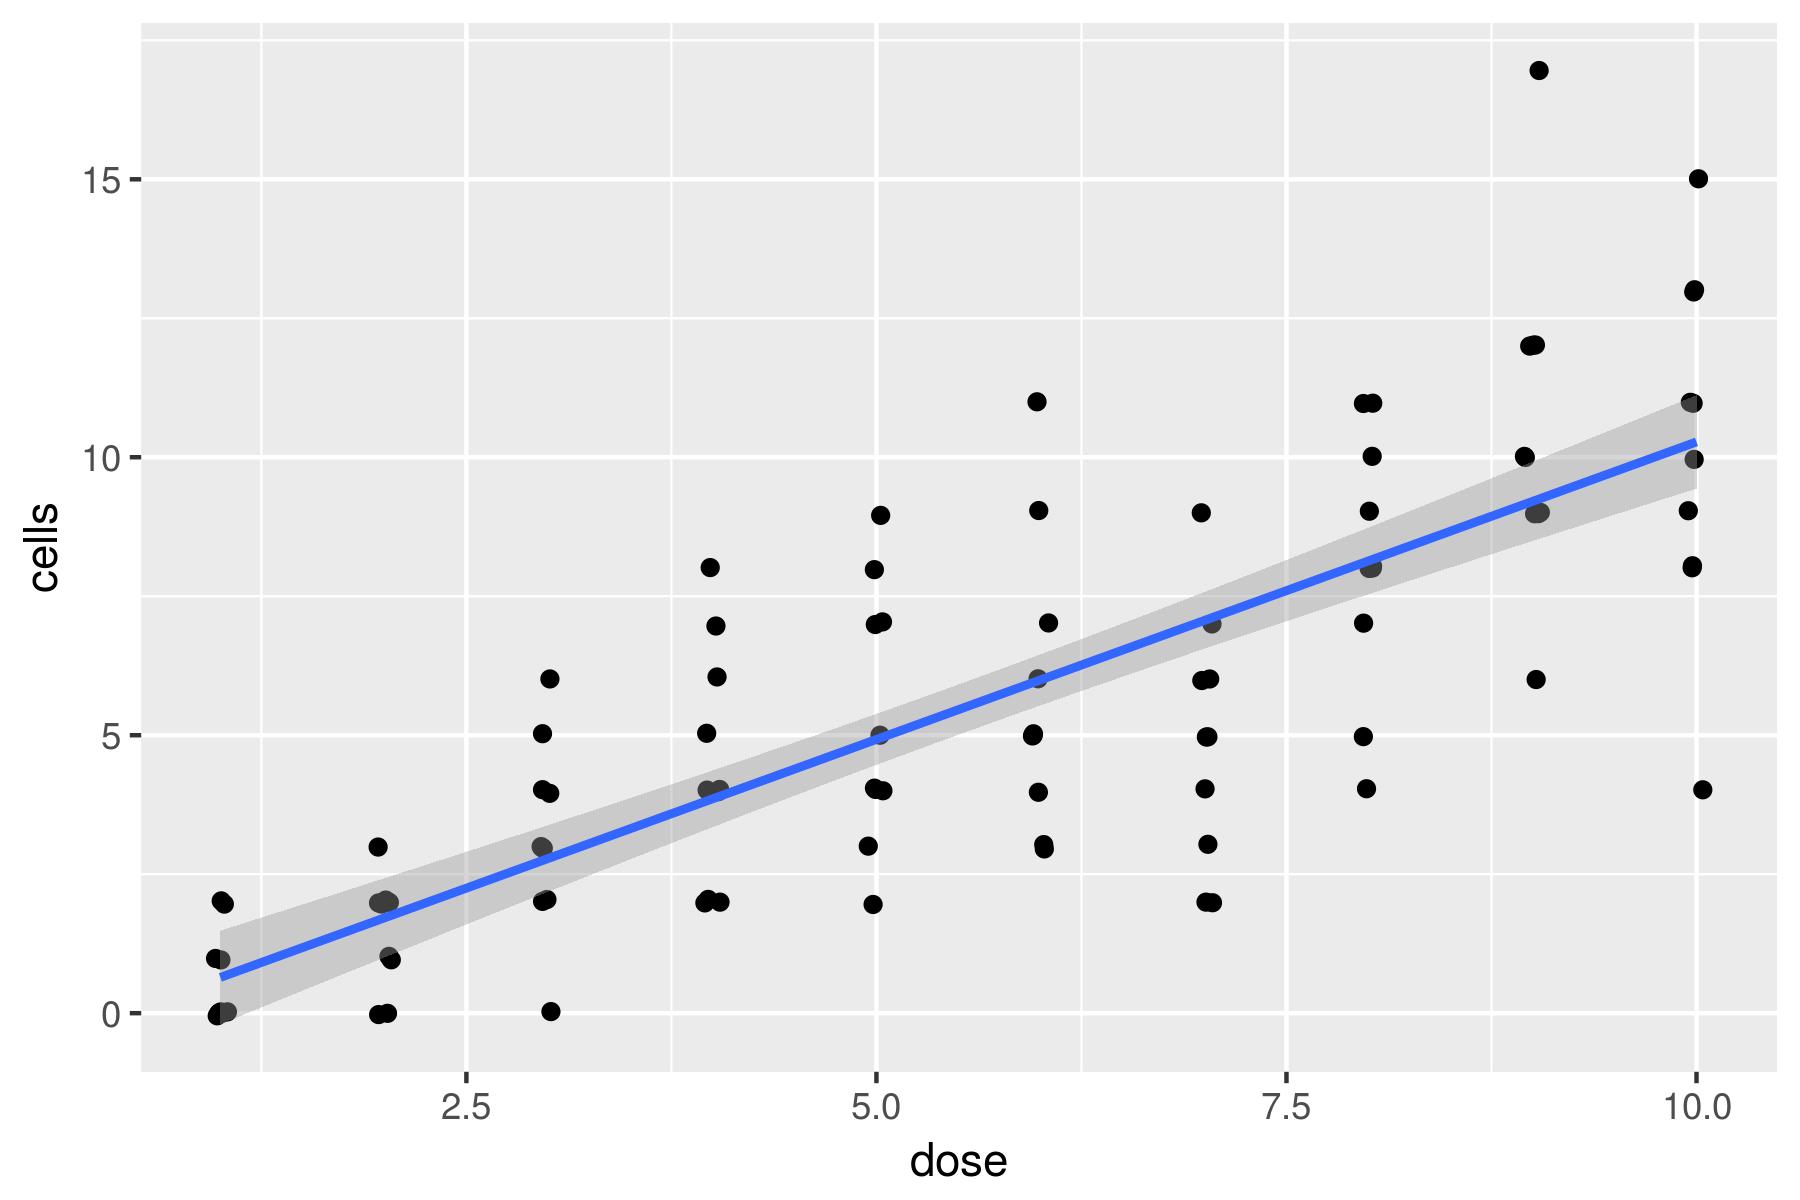
ตัวอย่าง GLM ด้วย geom_smooth() แบบค่าเริ่มต้น ซึ่งเป็น LM

Generalized Linear Models ใน R

Poisson GLM ด้วย geom_smooth()

ggplot(data = dat, aes(x = dose, y = cells)) +
   geom_jitter(width = 0.05, height = 0.05) +
   geom_smooth(method = 'glm', method.args = list(family = 'poisson'))
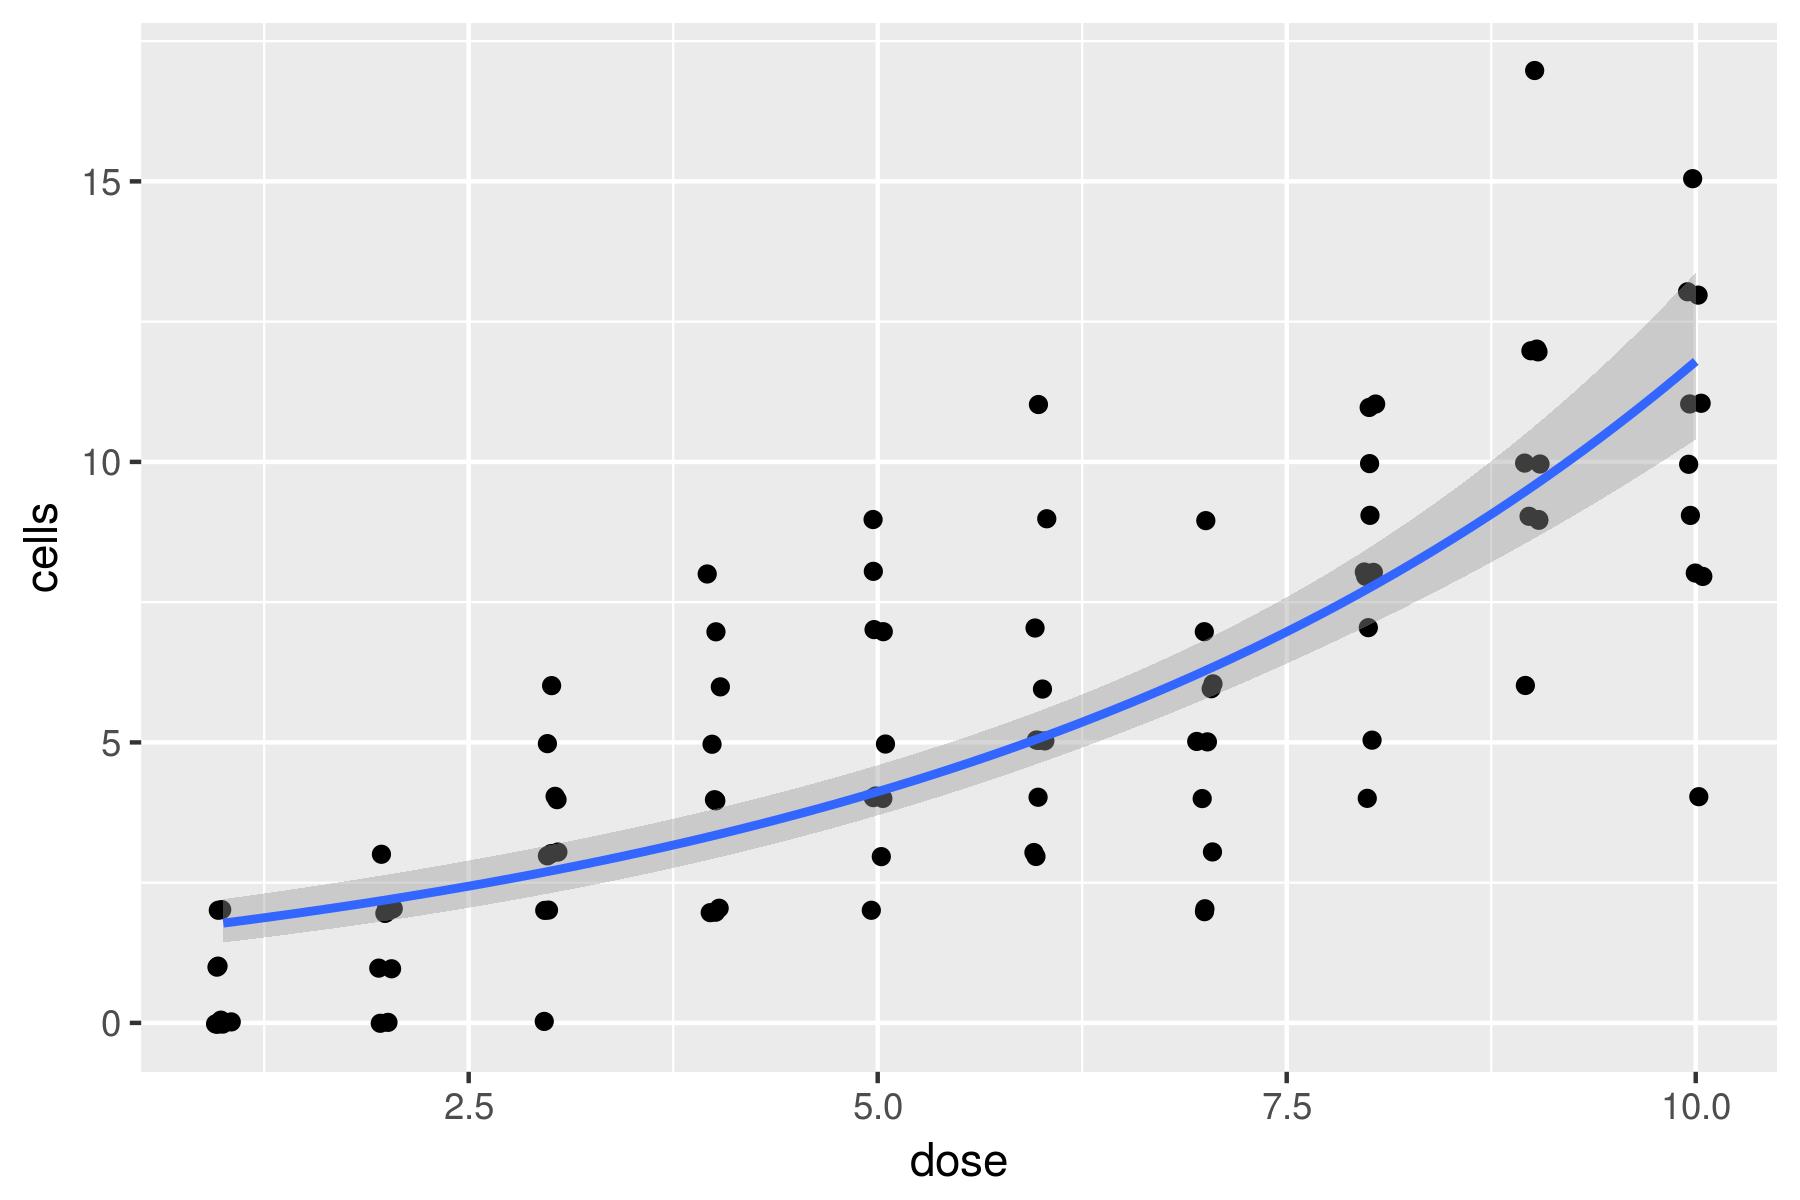
ตัวอย่างกราฟ Poisson regression

Generalized Linear Models ใน R

สรุปขั้นตอน

  • พล็อตจุดที่ไม่ซ้อนทับกัน
  • เพิ่มเส้นแนวโน้ม Poisson
  • ตกแต่งกราฟ (ไม่ได้ทำในที่นี้)
Generalized Linear Models ใน R

มาฝึกกันเถอะ!

Generalized Linear Models ใน R

Preparing Video For Download...