Interaktiva diagram med plotly

Bygga dashboards med shinydashboard

Png Kee Seng

Researcher

Exempel: Airbnb-annonser i London

  • Vi arbetar på ett researrangemang i London
  • Ett samarbete har inletts med Airbnb
    library(tidyverse)
    listings <- read_csv("../data/listings.csv")
    
...
 $ host_name                     : chr [1:69351] "Susie" "Alina" "Luca" "Simon" ...
 $ neighbourhood_group           : logi [1:69351] NA NA NA NA NA NA ...
 $ neighbourhood                 : chr [1:69351] "Tower Hamlets" "Islington" "Tower Hamlets" "Islington" ...
 $ latitude                      : num [1:69351] 51.5 51.6 51.5 51.5 51.5 ...
 $ longitude                     : num [1:69351] -0.054 -0.1127 -0.0743 -0.1048 -0.2 ...
 $ room_type                     : chr [1:69351] "Private room" "Private room" "Entire home/apt" "Private room" ...
 $ price                         : num [1:69351] 55 50 90 180 297 75 204 379 90 30 ...
 $ minimum_nights                : num [1:69351] 3 1 5 4 14 3 2 4 3 7 ...
 $ number_of_reviews             : num [1:69351] 65 30 42 493 6 89 581 51 104 32 ...
 $ last_review                   : Date[1:69351], format: "2016-06-10" "2022-07-15" "2022-01-04" "2022-09-02" ...
 $ reviews_per_month             : num [1:69351] 0.47 0.2 0.34 3.59 0.05 0.57 4.26 0.36 0.86 0.29 ...
 $ calculated_host_listings_count: num [1:69351] 1 2 1 5 1 1 1 5 1 1 ...
 $ availability_365              : num [1:69351] 74 343 222 236 180 70 193 249 318 251 ...
...
Bygga dashboards med shinydashboard

Kom igång med plotly

  • Importera plotly-biblioteket

    library(plotly)
    
  • Ett plotly-objekt skapas genom att placera ett ggplot-objekt i ggplotly()

    ggplotly(<ggplot object>)
    
Bygga dashboards med shinydashboard

Bubbeldiagram med ggplot

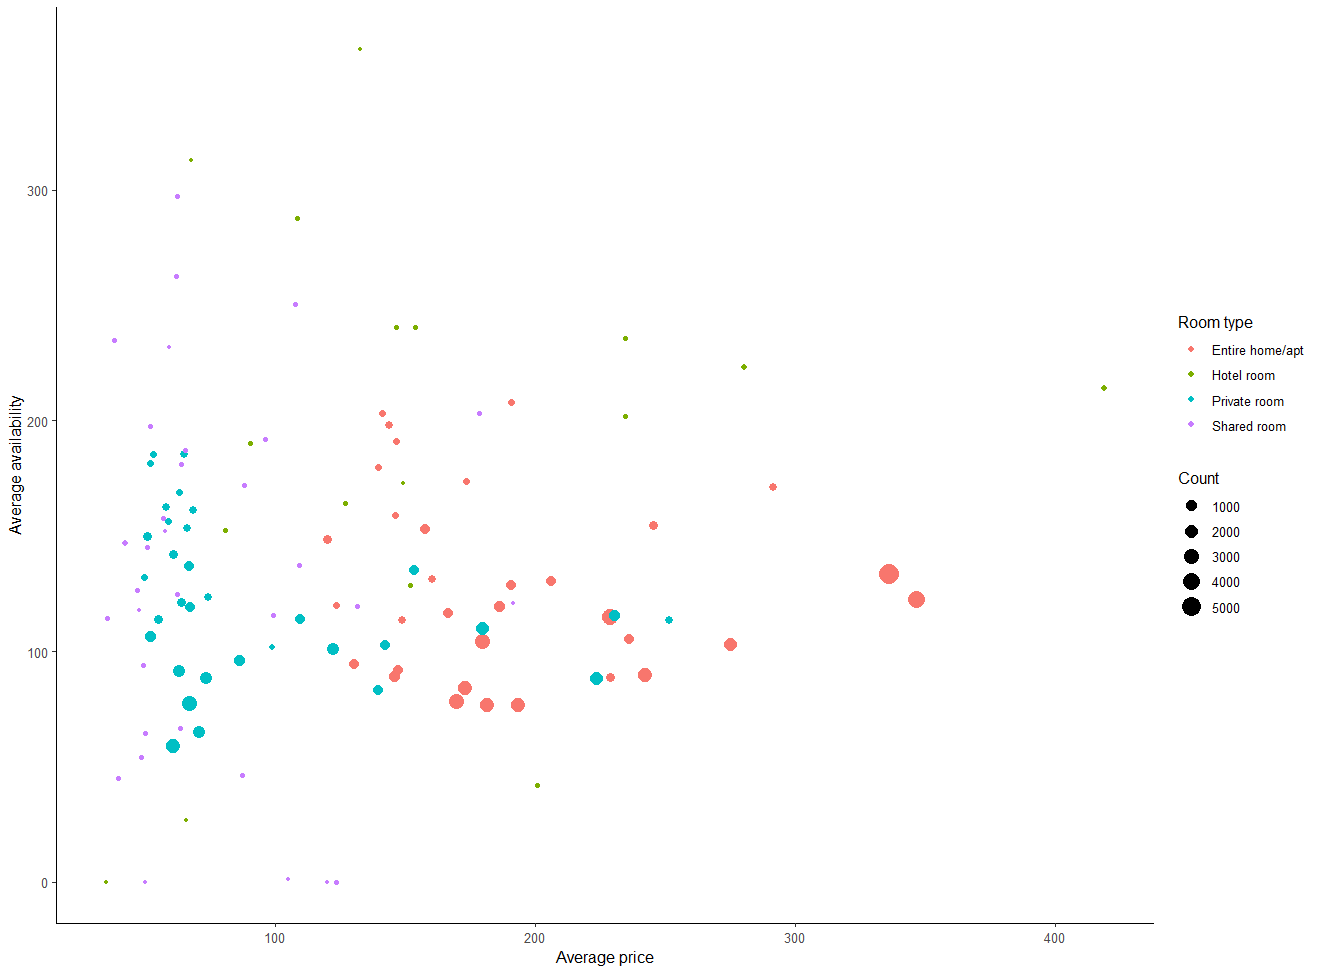
  • Skapa ett bubbeldiagram och spara det som bubble
    • Visa sambandet mellan genomsnittligt price och availability_365
    • Olika färg på bubblan för varje room_type
    • Bubbelns storlek är proportionell mot antalet annonser
    • Lägg till lager för att förbättra utseendet
bubble <- listings %>%

group_by(room_type, neighbourhood) %>% summarise(avg_price = mean(price, na.rm=TRUE), avg_availability = mean(availability_365, na.rm=TRUE),
Count = n(), .groups = "drop") %>%
ggplot(aes(x = avg_price, y = avg_availability,
color = room_type,
size = Count)) +
geom_point() +
labs(x = "Average price", y = "Average availability", color = "Room type") + theme_classic()
Bygga dashboards med shinydashboard

Bubbeldiagram med ggplot, renderat

Ett vanligt bubbeldiagram skapat med ggplot.

Bygga dashboards med shinydashboard

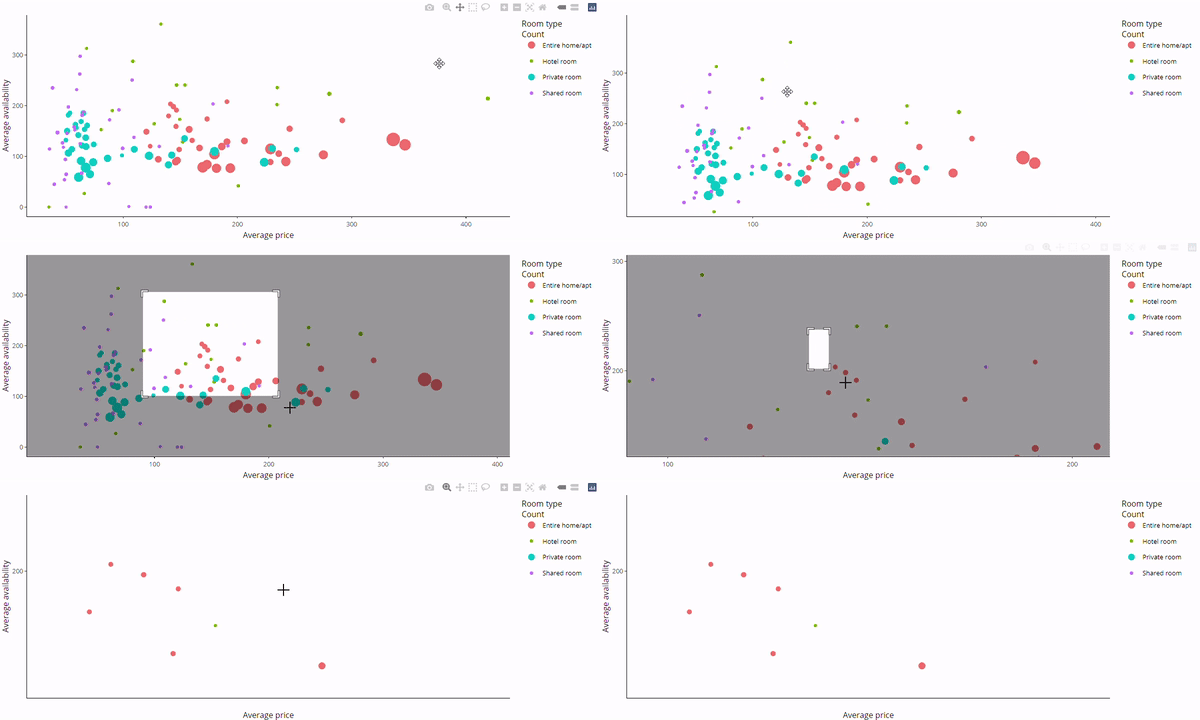
Interaktivt bubbeldiagram med plotly

  • Lägg bubble i ggplotly()
ggplotly(bubble)

Ett interaktivt plotly-bubbeldiagram.

Bygga dashboards med shinydashboard

Horisontella lådagram med plotly

  • Vissa diagram kan inte konverteras korrekt

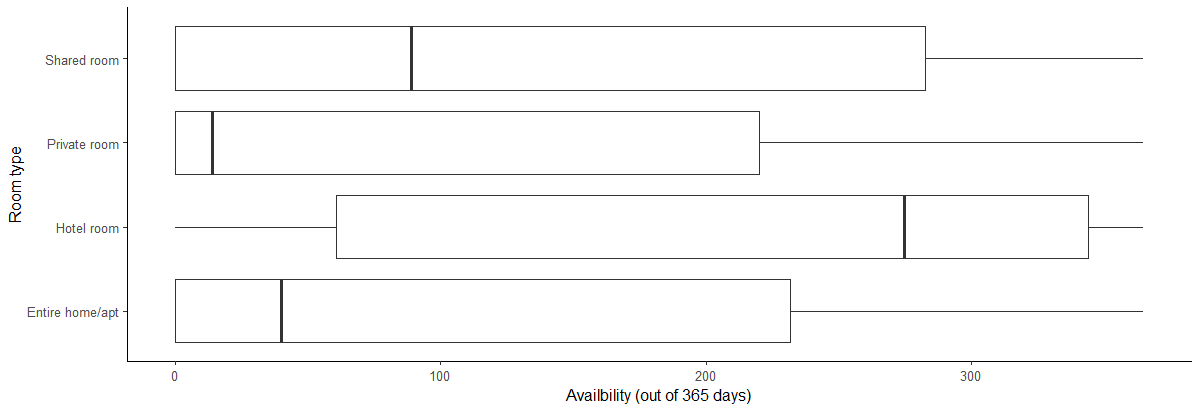
  • Skapa en serie horisontellt orienterade lådagram

    • Beskriv fördelningen av availability_365 med avseende på room_type
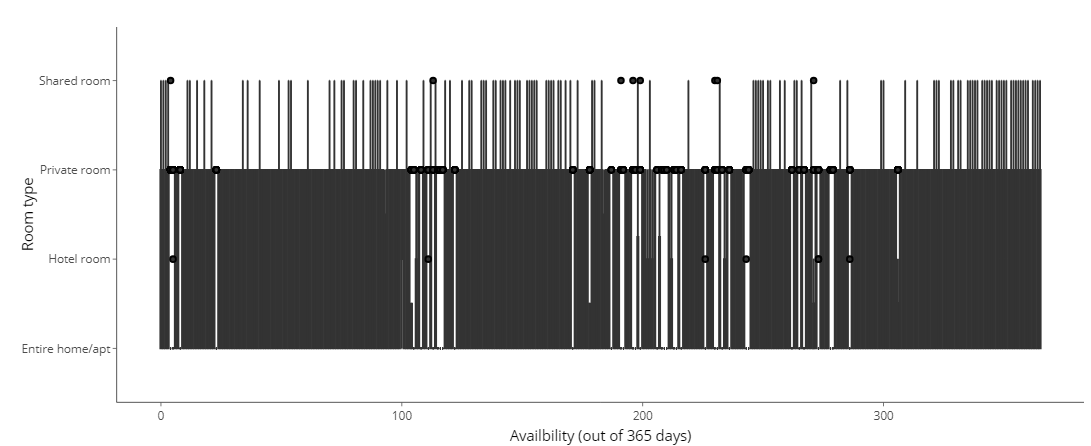
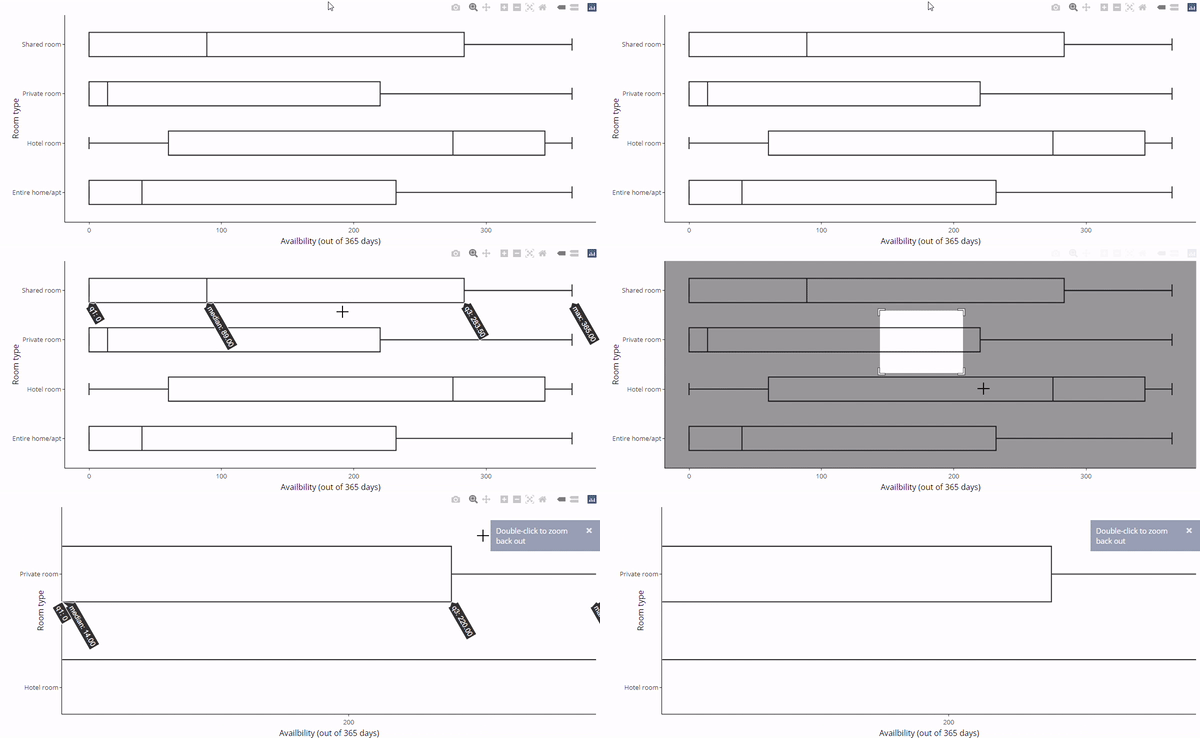
  • Konvertering med ggplotly() fungerar inte
boxH <- listings %>%

ggplot(aes(x = availability_365, y=room_type)) +
geom_boxplot() +
labs(x="Availbility (out of 365 days)", y="Room type") + theme_classic()
ggplotly(boxH)

Horisontellt orienterade lådagram skapade med ggplot.

Horisontellt orienterade lådagram konverterade med ggplotly.

Bygga dashboards med shinydashboard

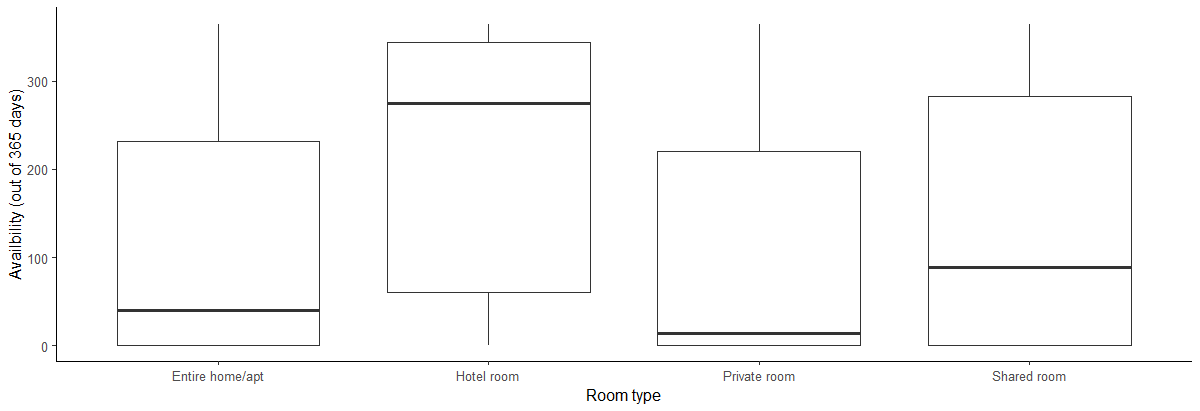
Vertikala lådagram med plotly

  • Byt plats på x och y i aes()
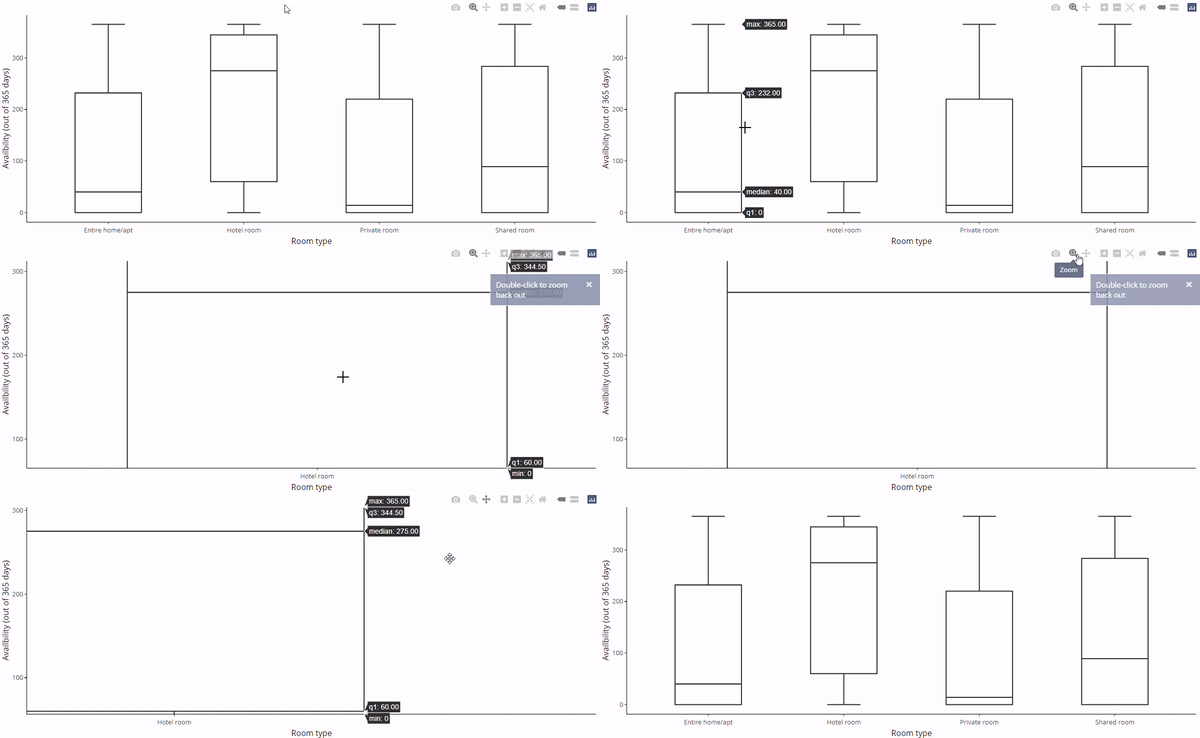
  • Konvertering med plotly fungerar nu
boxV <- listings %>%

ggplot(aes(y = availability_365, x=room_type)) + geom_boxplot() + labs(y="Availbility (out of 365 days)", x="Room type") + theme_classic()
ggplotly(boxV)

Vertikalt orienterade lådagram med ggplot.

Vertikalt orienterade lådagram med ggplotly.

Bygga dashboards med shinydashboard

Fixa horisontella lådagram med plotly

  • Vad gör vi om vi vill ha horisontella lådagram?
    • Lägg till coord_flip()
  • Vi kan också använda facet_wrap()
    • Varje panel måste vara tillräckligt stor
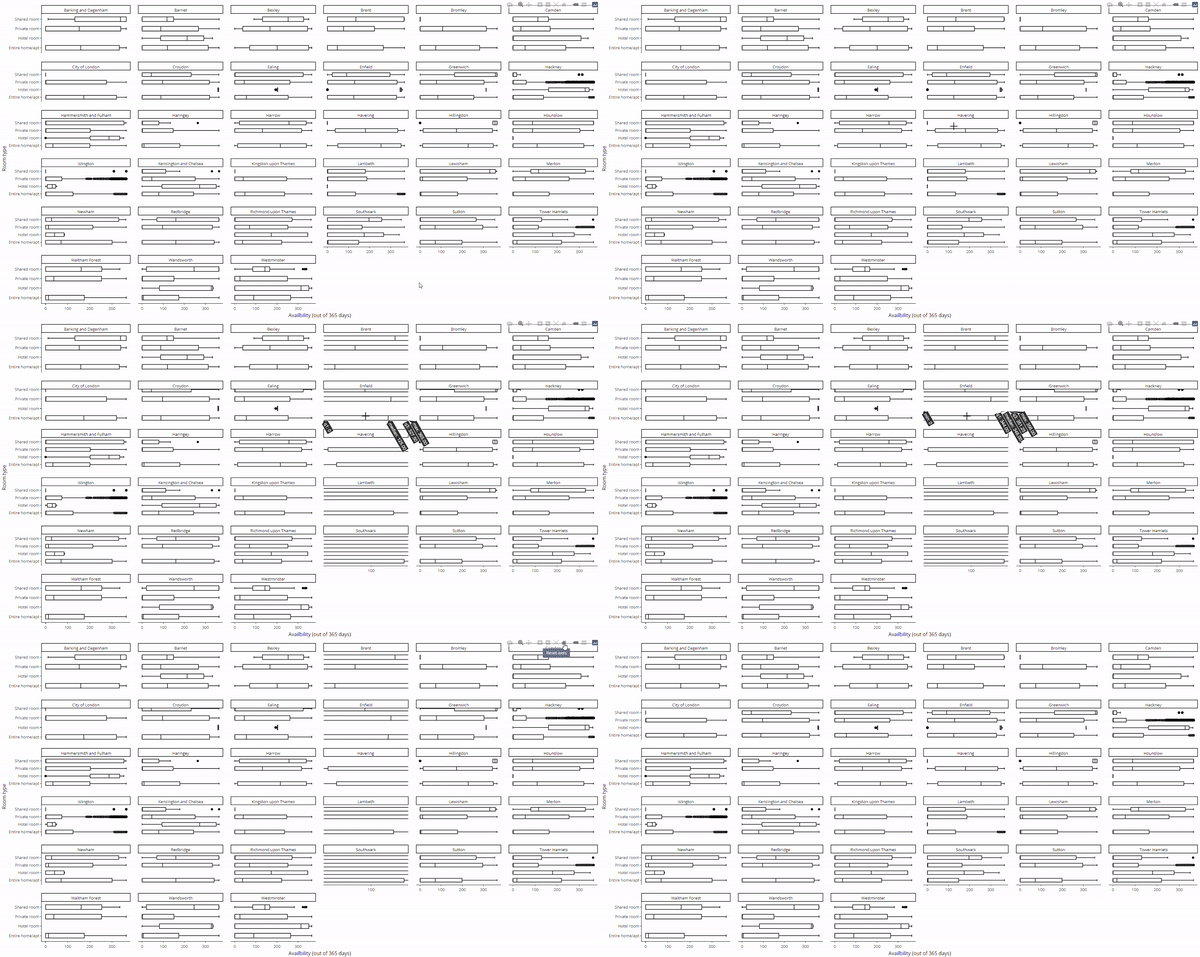
ggplotly(boxV + coord_flip())
ggplotly(boxV + coord_flip() + 
    facet_wrap(~neighbourhood))

Vända vertikala plotly-lådagram.

Facetterade plotly-lådagram.

Bygga dashboards med shinydashboard

Nu kör vi en övning!

Bygga dashboards med shinydashboard

Preparing Video For Download...