shinydashboard แรกของคุณ

การสร้างแดชบอร์ดด้วย shinydashboard

Png Kee Seng

Researcher

ทบทวนสิ่งที่ผ่านมา

  • การออกแบบ UI
    • Header, side bar, body
  • กำหนด output และการโต้ตอบกับ input ของผู้ใช้
  • server จะทำหน้าที่นี้

drawing

header <- dashboardHeader(...)
sidebar <- dashboardSidebar(...)
body <- dashboardBody(...)

ui <- dashboardPage(header, sidebar, body)
server <- function(input, output) { ... }
shinyApp(ui, server)
การสร้างแดชบอร์ดด้วย shinydashboard

server

  • ต้องกำหนด output และ input
  • ระบุ output และการโต้ตอบกับ input ของผู้ใช้
  • ควรสร้าง helper function เพื่อให้โค้ดอ่านง่ายขึ้น
    • วาง helper function ไว้ที่ด้านบนของโค้ด

server เปรียบเหมือนพนักงานเสิร์ฟที่รับคำสั่งและส่งต่อไปยังครัว server ใน shinyApp บอก R ว่า input ควรโต้ตอบกับ output อย่างไร

การสร้างแดชบอร์ดด้วย shinydashboard

เพิ่ม plot

  • กลับมาที่ dashboard การแข่งขันฟุตบอล
  • เพิ่ม hexbin plot สำหรับ ทีม 1
  • จากนั้นนำ plot นี้ไปไว้ใน server
  • ถ้าต้องการ plot เดียวกันสำหรับ ทีม 2 ล่ะ?
soccer %>%
  ggplot(aes(x=`1_passes_compeletd`, 
             y=`1_goal_prevented`)) +
  geom_hex(bins=10) + theme_classic()
server <- function(input, output){
  output$plot1 <- renderPlot({
  fifa %>%
    ggplot(aes(x=`1_passes_compeletd`, 
               y=`1_goal_prevented`)) +
    geom_hex(bins=10) + theme_classic()
  })
}
การสร้างแดชบอร์ดด้วย shinydashboard

กำหนด ggplot object ภายใน server

server <- function(input, output) {
  output$plot1 <- renderPlot({
    if (input$team == 1){

fifa %>% ggplot(aes(x=`1_passes_compeletd`, y=`1_goal_prevented`)) + geom_hex(bins=10) + theme_classic()
} else if (input$team == 2){
fifa %>% ggplot(aes(x=`2_passes_compeletd`, y=`2_goal_prevented`)) + geom_hex(bins=10) + theme_classic()
} }) }
การสร้างแดชบอร์ดด้วย shinydashboard

การใช้ helper function

plot_hex <- function(team){
  if (team == 1){
    soccer %>% ggplot(aes(x=`1_passes_compeletd`, 
                        y=`1_goal_prevented`)) +
      geom_hex(bins=10) + theme_classic()
  }
  else if (team == 2){
    soccer %>% ggplot(aes(x=`2_passes_compeletd`, 
                        y=`2_goal_prevented`)) +
      geom_hex(bins=10) + theme_classic()
  }
}
การสร้างแดชบอร์ดด้วย shinydashboard

การใช้ helper function

แบบมี helper function

server <- function(input, output) {
  output$plot1 <- renderPlot(plot_hex(input$team)) 
}
  • อ่านง่ายกว่ามากใช่ไหม?

แบบไม่มี helper function

server <- function(input, output) {
  output$plot1 <- renderPlot({
    if (input$team == 1){
      soccer %>% ggplot(aes(x=`1_passes_compeletd`, 
              y=`1_goal_prevented`)) +
        geom_hex(bins=10) + theme_classic()
      }
    else if (input$team == 2){
      soccer %>% ggplot(aes(x=`2_passes_compeletd`, 
              y=`2_goal_prevented`)) +
        geom_hex(bins=10) + theme_classic()
      }
    })
}
การสร้างแดชบอร์ดด้วย shinydashboard

รวมทุกส่วนเข้าด้วยกัน

# A complete shinydashboard

header <- dashboardHeader(title = "Soccer tournament")
sidebar <- dashboardSidebar(sidebarMenu(menuItem("Passes/goals", tabName = "passtab"), menuItem("Empty", tabName = "emptytab")))
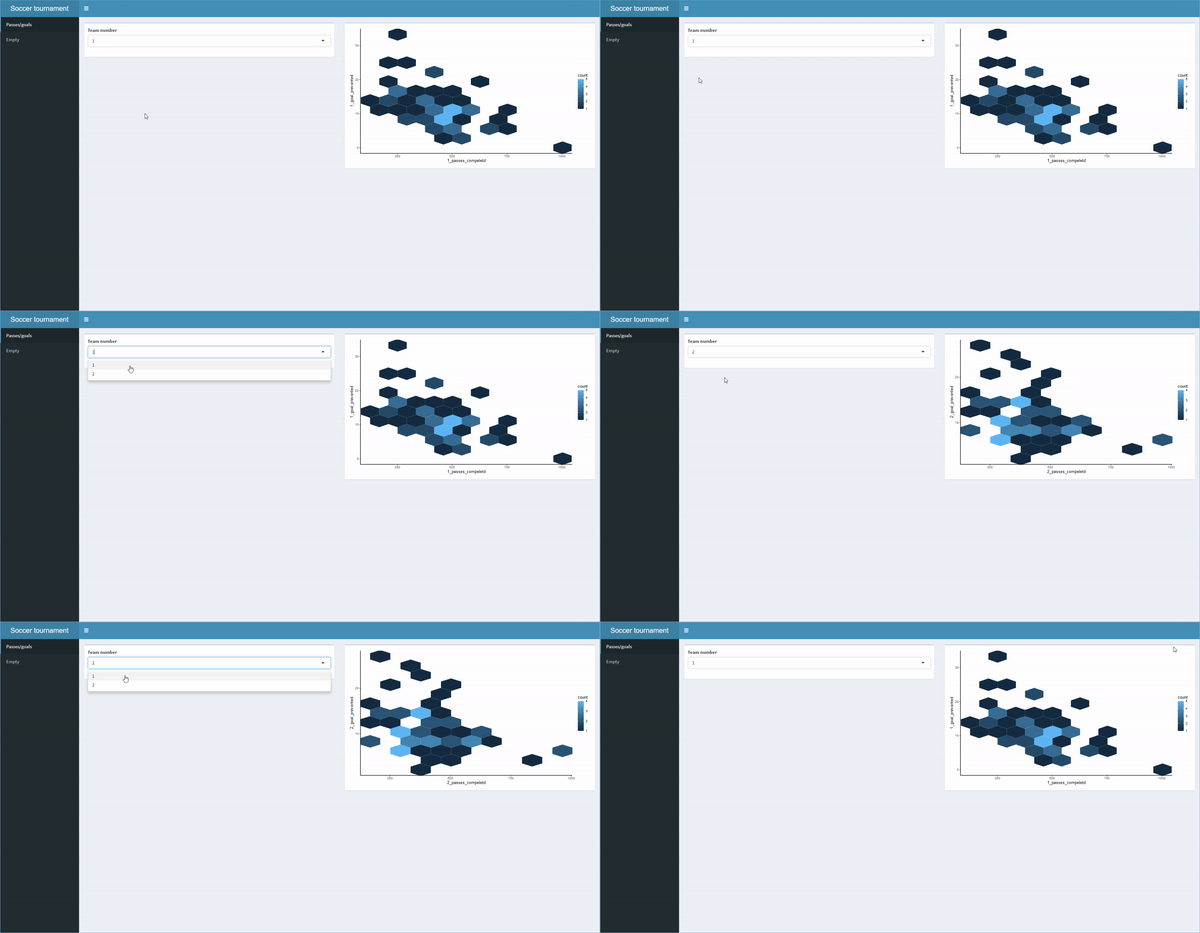
body <- dashboardBody(tabItems( tabItem("passtab", fluidRow(box(selectInput("team", "Team number", choices = c(1,2))), box(plotOutput("plot1"))) ), tabItem("emptytab")) )
ui <- dashboardPage(header, sidebar, body)
server <- function(input, output) { output$plot1 <- renderPlot(plot_hex(input$team)) }
shinyApp(ui, server)
การสร้างแดชบอร์ดด้วย shinydashboard

ภาพเคลื่อนไหวแสดงผลลัพธ์ของ shinydashboard ที่ render แล้ว ผู้ใช้สามารถสลับระหว่างหน้าหรือแท็บต่าง ๆ และป้อน input เพื่อรับ output ที่แตกต่างกันได้

การสร้างแดชบอร์ดด้วย shinydashboard

มาฝึกกันเถอะ!

การสร้างแดชบอร์ดด้วย shinydashboard

Preparing Video For Download...