Body

การสร้างแดชบอร์ดด้วย shinydashboard

Png Kee Seng

Researcher

ภาพรวม

  • ส่วนหลักของ shinydashboard UI
  • โดยทั่วไป inputs และ outputs จะถูกวางไว้ที่นี่
    • เปรียบได้กับอาหารและออร์เดอร์ในร้านอาหาร
    • server ทำหน้าที่เป็นตัวกลางในการสื่อสาร
  • body กำหนดด้วย dashboardBody() และโดยปกติจะเก็บในตัวแปรชื่อ body
body <- dashboardBody(...)
การสร้างแดชบอร์ดด้วย shinydashboard

Wireframing

  • ทำ wireframing
    • กำหนดโครงสร้างก่อนใส่เนื้อหา
  • ใน shinydashboard ให้กำหนดตำแหน่งของออบเจกต์ก่อน

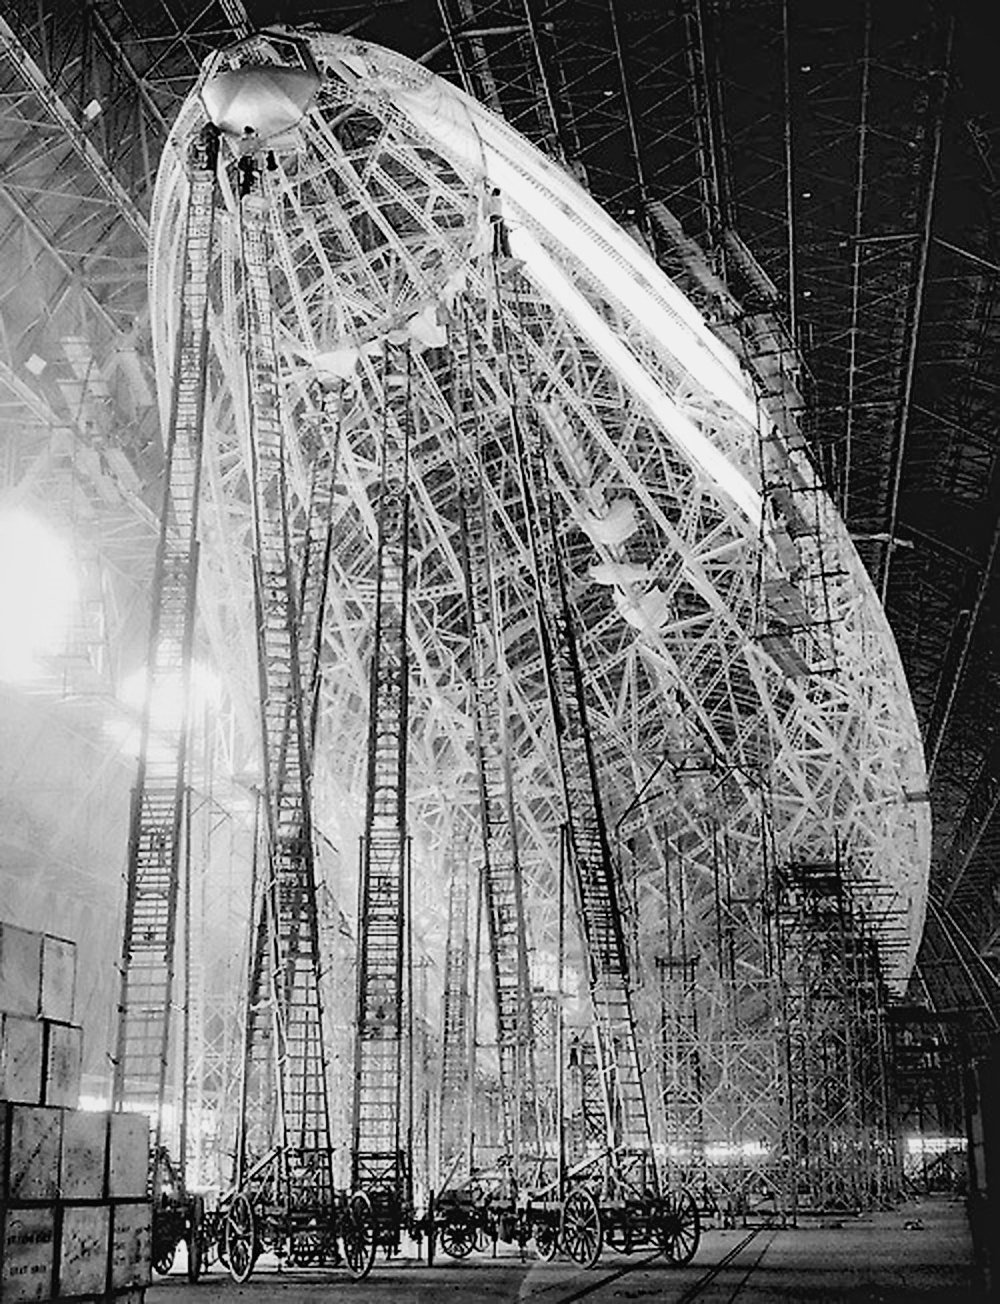
Wireframe ของเรือเหาะ

1 Brett Jordan, Flickr
การสร้างแดชบอร์ดด้วย shinydashboard

เพิ่มแถวและกล่อง: กล่องว่าง

  • เพิ่มแถวด้วย fluidRow()
  • เพิ่มกล่องด้วย box()

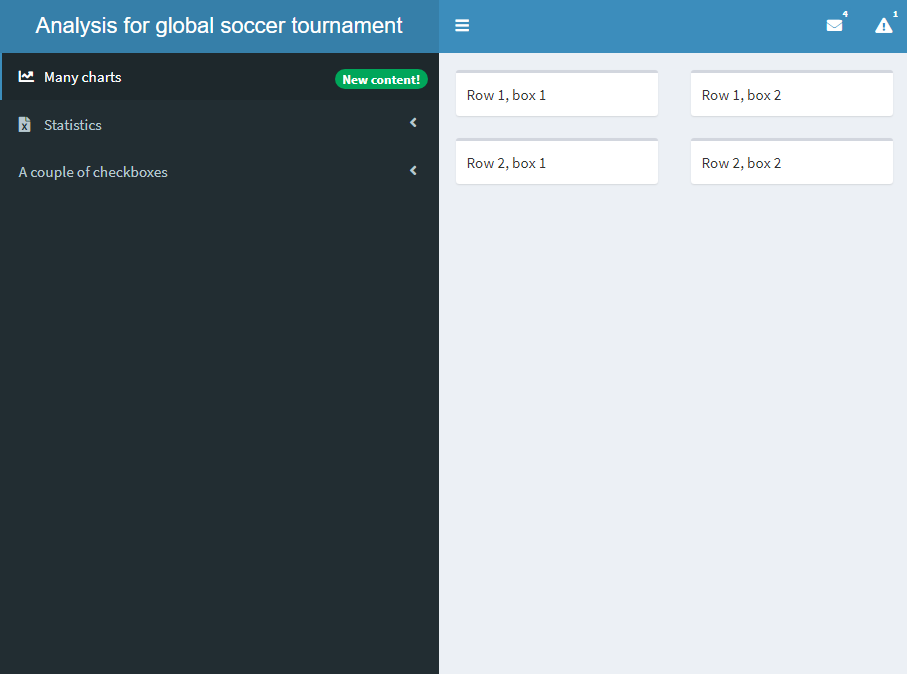
Dashboard สองแถว แต่ละแถวมีสองกล่องว่าง

body <- dashboardBody(

fluidRow(
box("Row 1, box 1"), box("Row 1, box 2")
), fluidRow(
box("Row 2, box 1"), box("Row 2, box 2")
)
)
การสร้างแดชบอร์ดด้วย shinydashboard

เพิ่มแถวและกล่อง: เนื้อหาในกล่อง

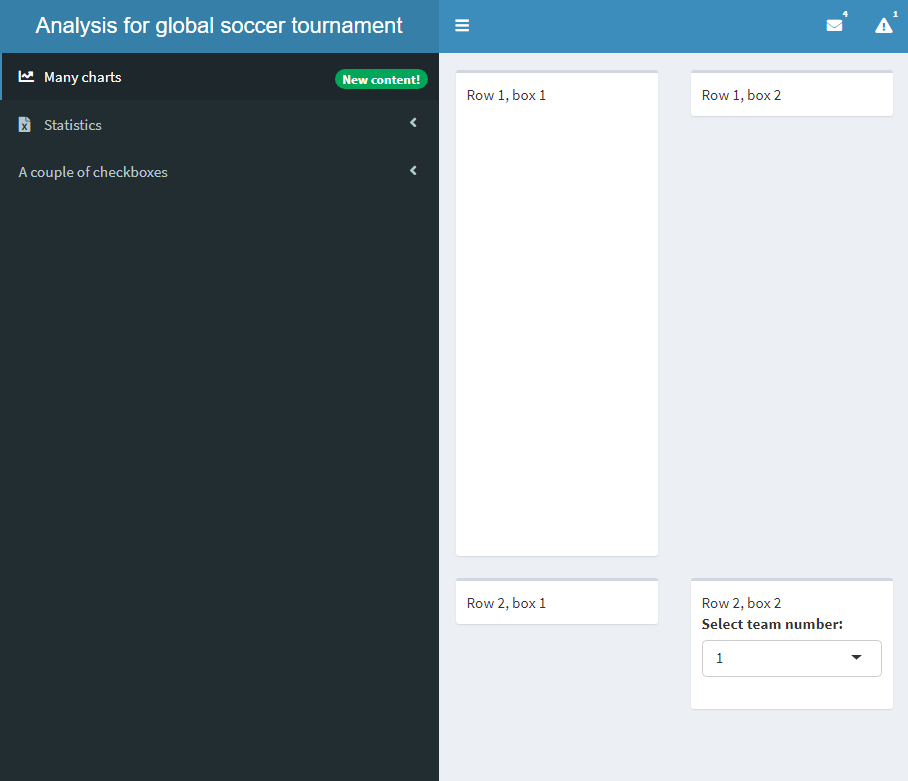
Body ที่มีสี่กล่องและมีเนื้อหาในบางกล่อง

body <- dashboardBody(
  fluidRow(box("Row 1, box 1", 

plotOutput('plot')),
box("Row 1, box 2")), fluidRow(box("Row 2, box 1"), box("Row 2, box 2",
selectInput("select", "Select team number:", choices = c(1,2))))
)
การสร้างแดชบอร์ดด้วย shinydashboard

ป้องกันกล่องล้น

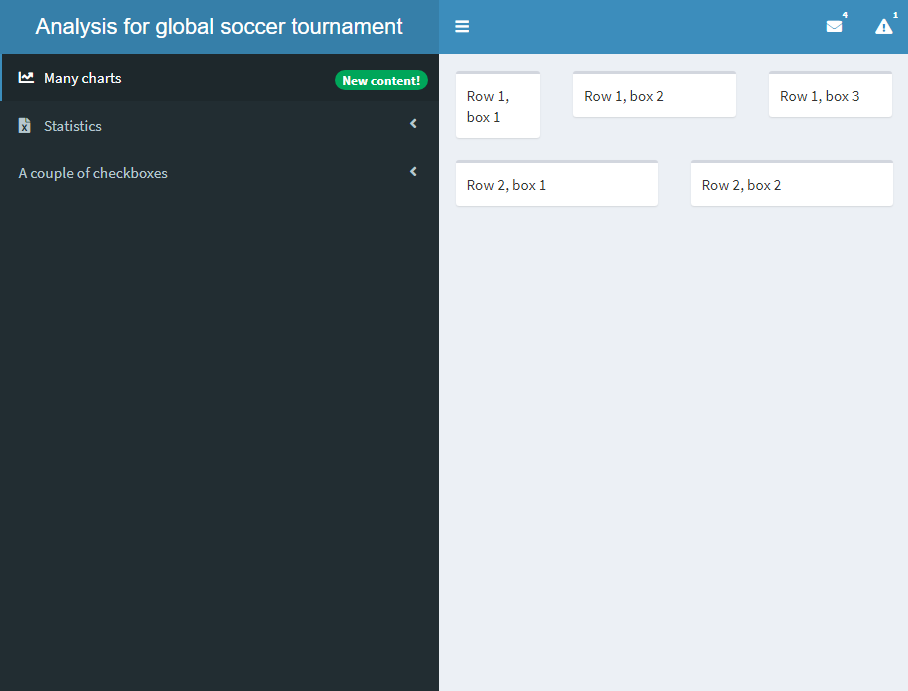
  • แต่ละกล่องใช้พื้นที่ 6 จาก 12 หน่วยในแนวนอนโดยค่าเริ่มต้น
  • เพื่อป้องกันการล้น ให้กำหนด width
    • ในตัวอย่างนี้ กำหนด width เป็น 3, 5 และ 4
  • แนะนำให้เพิ่ม box() เสมอ

กล่องเพิ่มเติมใน body

body <- dashboardBody(
  fluidRow(box("Row 1, box 1"), 
           box("Row 1, box 2"),
           box("Row 1, box 3")),
  fluidRow(box("Row 2, box 1"), 
           box("Row 2, box 2"))
)
body <- dashboardBody(
  fluidRow(box("Row 1, box 1", width = 3), 
           box("Row 1, box 2", width = 5),
           box("Row 1, box 3", width = 4)),
  fluidRow(box("Row 2, box 1"), 
           box("Row 2, box 2"))
)
การสร้างแดชบอร์ดด้วย shinydashboard

valueBox และ infoBox

  • มีกล่องสำหรับแสดงข้อมูลสั้น ๆ ด้วย
    • valueBox()
    • infoBox()

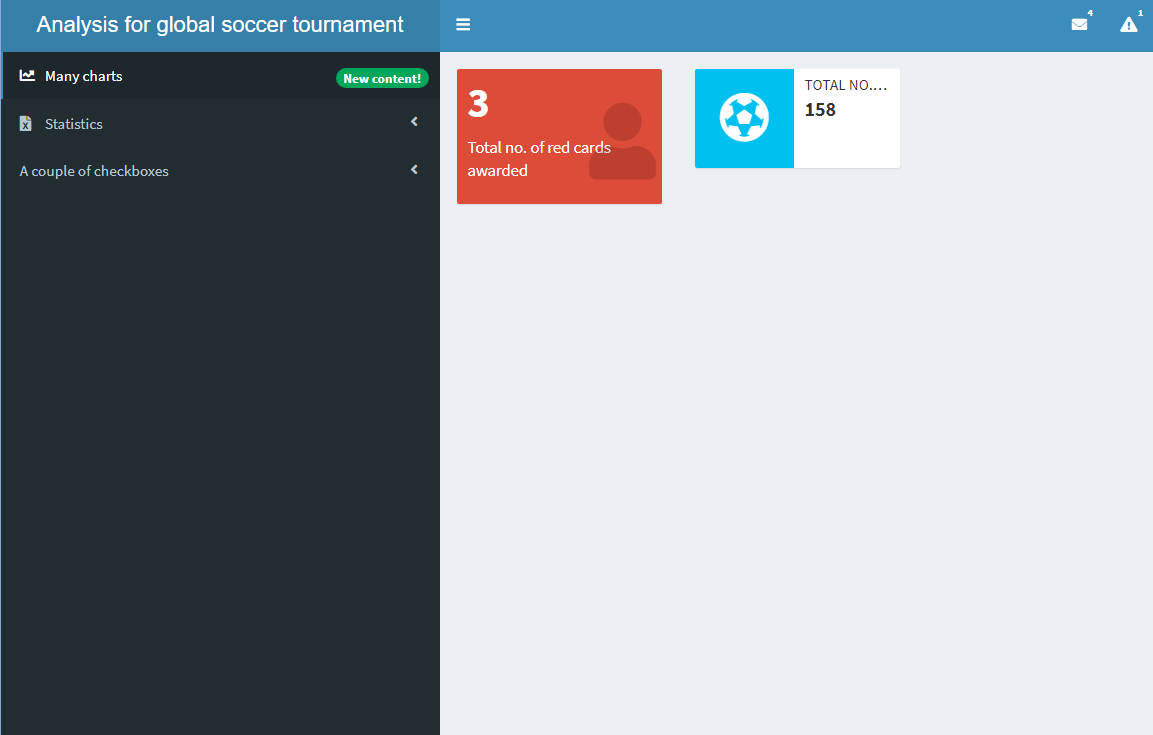
valueBox และ infoBox ใน body

body <- dashboardBody(
  fluidRow(valueBox(value = 3, 
                    subtitle = "Total no. of red cards awarded", 
                    icon = icon("user"),
                    color = "red"),

infoBox(value = 158, title = "Total no. of goals scored", icon = icon("futbol")) ))
การสร้างแดชบอร์ดด้วย shinydashboard

valueBoxOutput และ infoBoxOutput

  • รูปแบบ output ของ valueBox() และ infoBox() ได้แก่ valueBoxOutput() และ infoBoxOutput()
  • ทั้งสองเป็นฟังก์ชัน output
  • มี renderValueBox() และ renderInfoBox() ด้วย
  • จำเป็นต้องใช้ valueBox() และ infoBox() ภายใน

valueBoxOutput และ infoBoxOutput ใน body ผลลัพธ์ที่ได้เหมือนกับตัวอย่างก่อนหน้า

body <- dashboardBody(
  fluidRow(valueBoxOutput(outputId = "valuebox1"),
           infoBoxOutput(outputId = "infobox1")
           ))
server <- function(input, output){
  output$valuebox1 <- renderValueBox(
    valueBox(3, "Total no. of red cards awarded",
                icon = icon("user"), color = "red"))
  output$infobox1 <- renderInfoBox(
    infoBox(158, 
                   title = "Total no. of goals scored", 
                   icon = icon("futbol")))
}
การสร้างแดชบอร์ดด้วย shinydashboard

ความสัมพันธ์ระหว่าง valueBoxOutput และ plotOutput

  • plotOutput():
    • วางใน UI
    • กำหนดตำแหน่งใน shinydashboard
  • renderPlot():
    • วางใน server()
    • บรรจุออบเจกต์ ggplot()
  • valueBoxOutput():
    • วางใน UI
    • กำหนดตำแหน่งใน shinydashboard
  • renderValueBox():
    • วางใน server()
    • บรรจุออบเจกต์ valueBox()
การสร้างแดชบอร์ดด้วย shinydashboard

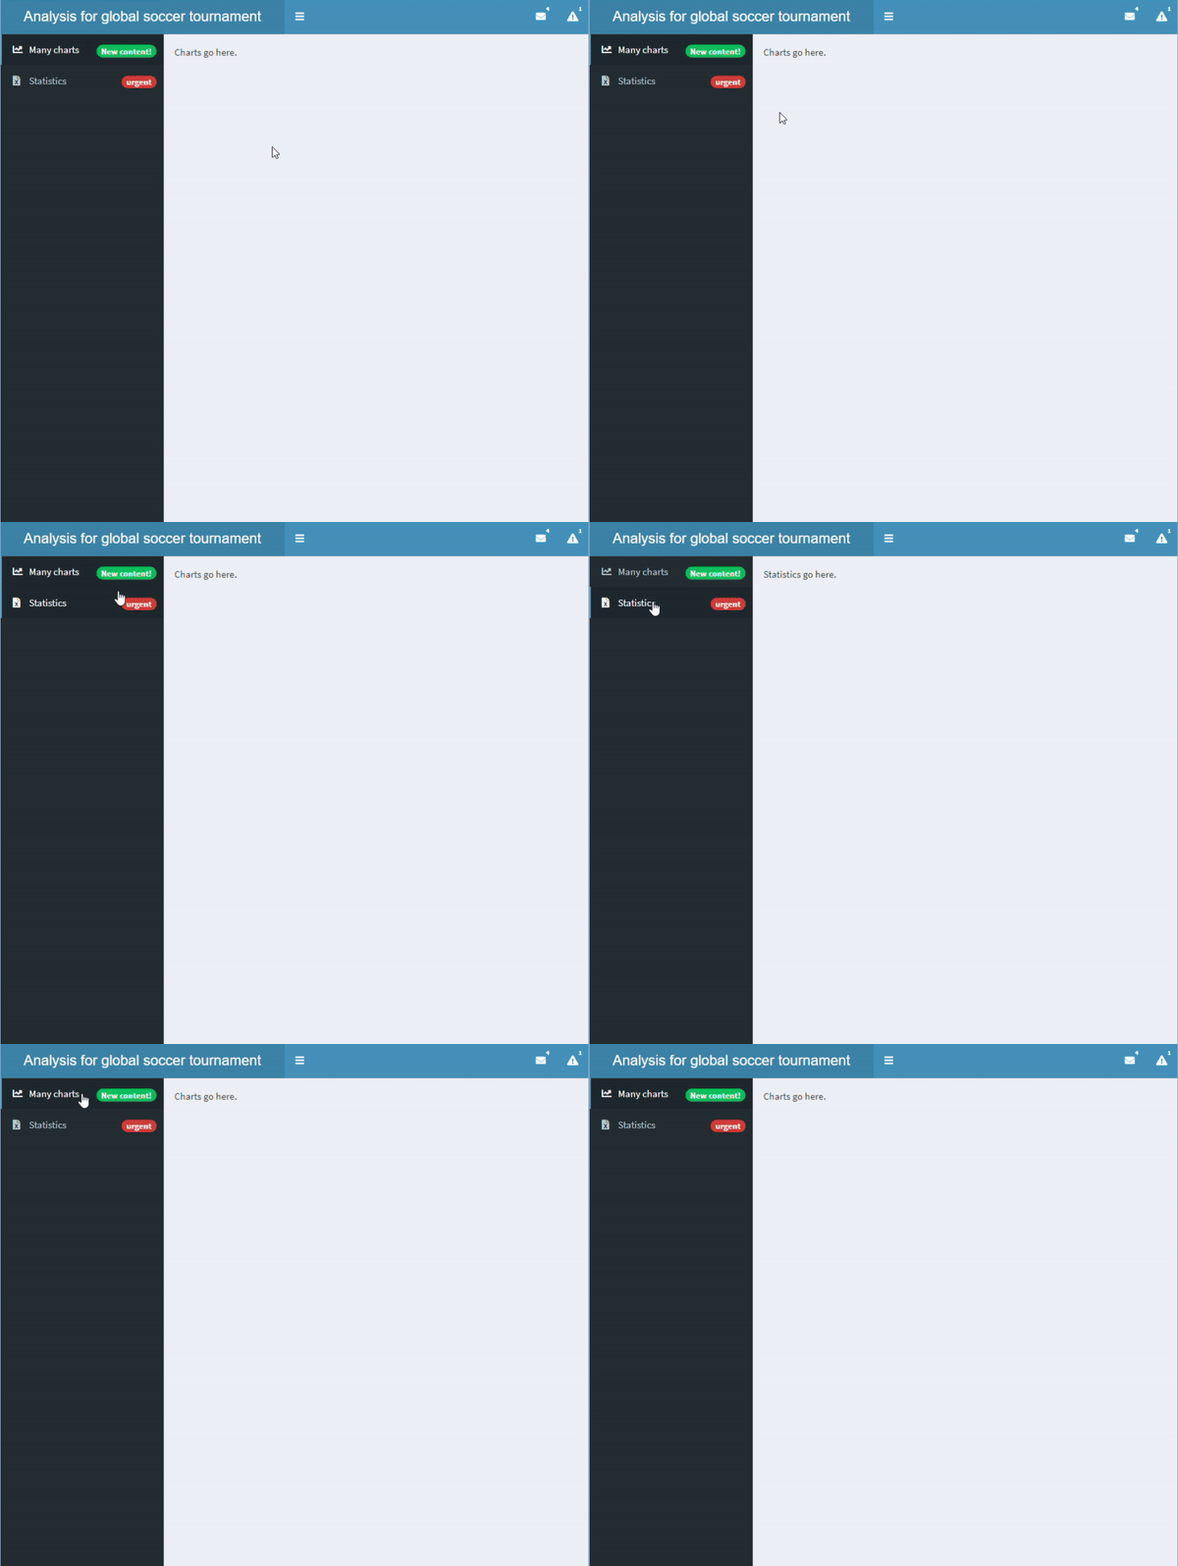
เชื่อมต่อ sidebar กับ body

  • จำได้ไหมว่า sidebar มีสองปุ่มชื่อ "charts" และ "statistics"
  • เพื่อเชื่อมต่อกับ body ต้องเพิ่ม tabItems()
    • แต่ละหน้ากำหนดด้วย tabItem()
    • label ของคู่ menuItem()-tabItem() ต้องตรงกัน

body และ sidebar เชื่อมต่อกันแล้ว

sidebar <- dashboardSidebar(
  sidebarMenu(
    id = "pages",

menuItem("Many charts", tabName = "charts", icon = icon("chart-line"), badgeLabel = "New content!", badgeColor = "green"),
menuItem("Statistics", icon = icon("file-excel"), tabName = "statistics", badgeLabel = "urgent", badgeColor = "red") ))
body <- dashboardBody( tabItems(
tabItem("charts", "Charts go here." ), tabItem("statistics", "Statistics go here." )))
การสร้างแดชบอร์ดด้วย shinydashboard

แท็บใน body

  • ใน shinyApp สามารถสร้างชุดแท็บด้วย tabsetPanel()
    • แต่ละแท็บกำหนดด้วย tabPanel()
  • อย่าสับสนกับ tabItems() และ tabItem()

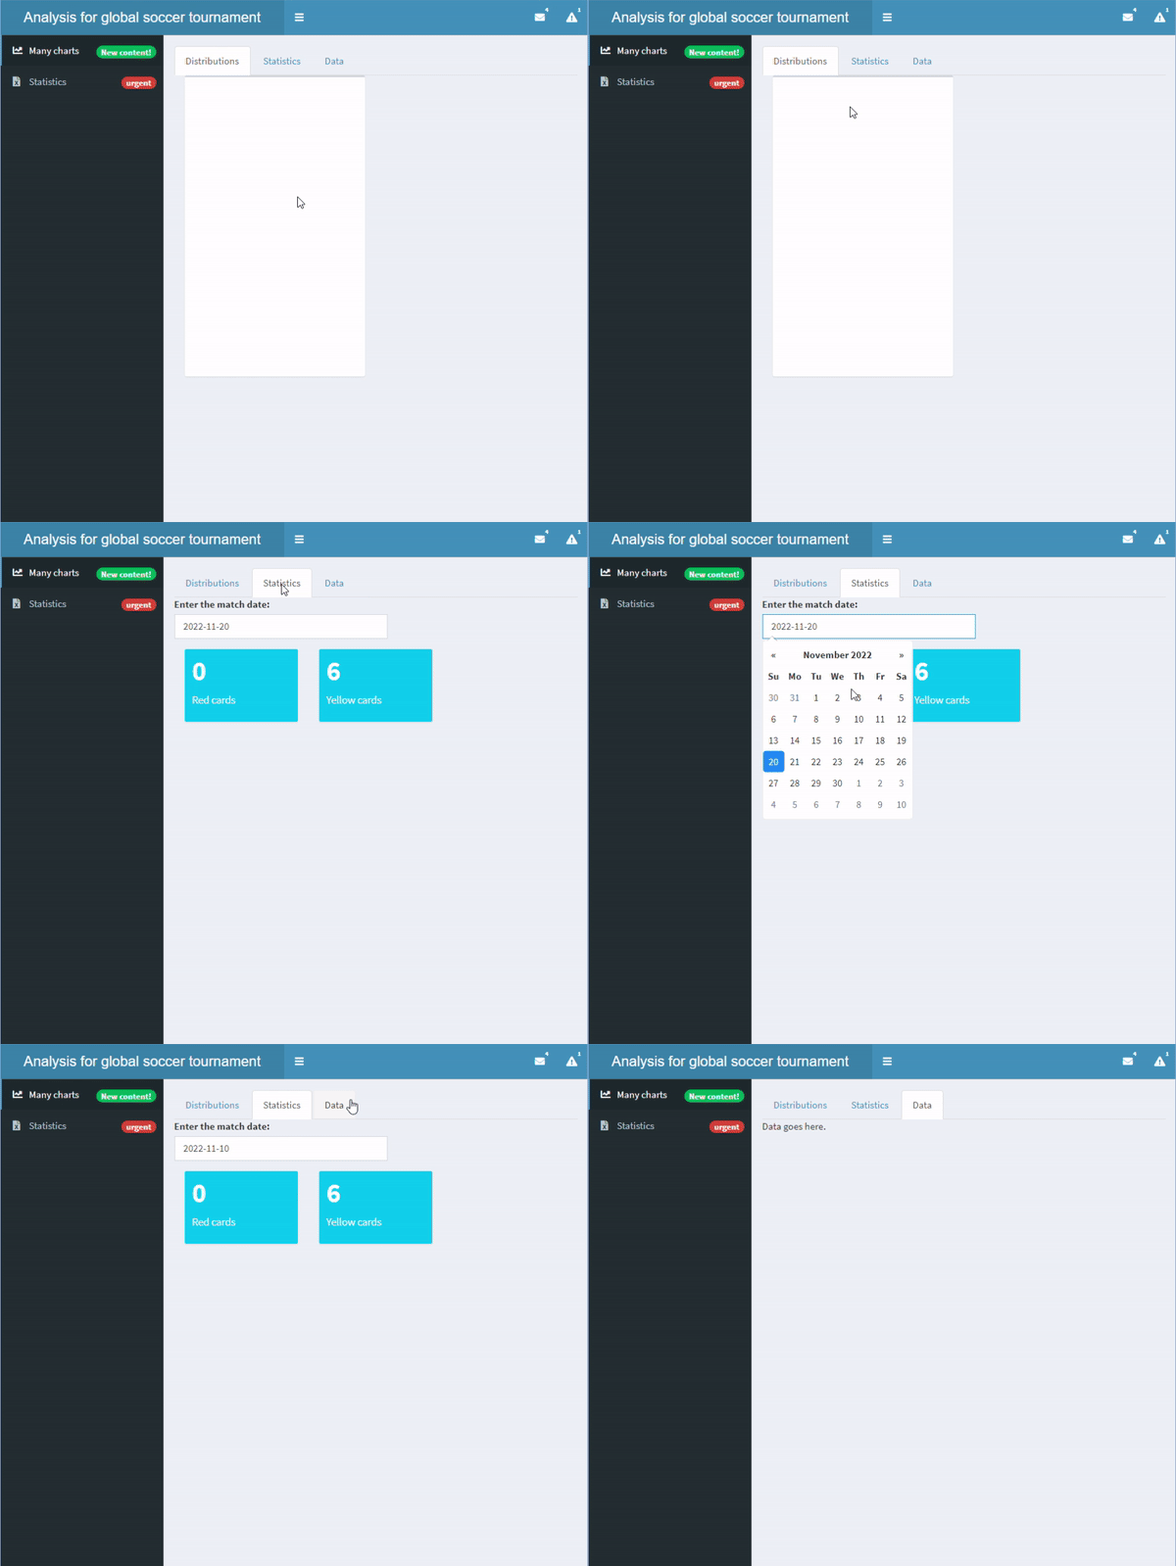
เพิ่ม tabset ภายใน body

body <- dashboardBody(tabsetPanel(

tabPanel("Distributions", box(plotOutput("dist"))), tabPanel("Statistics", dateInput("matchdate", "Enter the match date:", value = "2022-11-20"), valueBoxOutput("red"), valueBoxOutput("yellow")), tabPanel("Data", "Data goes here.", tableOutput("data"))
))
server <- function(input, output){ output$red <- renderValueBox(valueBox(0, "Red cards")) output$yellow <- renderValueBox(valueBox(6, "Yellow cards")) }
การสร้างแดชบอร์ดด้วย shinydashboard

มาฝึกกันเถอะ!

การสร้างแดชบอร์ดด้วย shinydashboard

Preparing Video For Download...