ประเภทของ output

การสร้างแดชบอร์ดด้วย shinydashboard

Png Kee Seng

Researcher

ฟังก์ชัน output และ render

  • ใน shinyApp จะมี output
  • แต่ละ output ต้องเรียกใช้ฟังก์ชันเป็นคู่

    • ฟังก์ชันแรกอยู่ใน UI
    • ใช้กำหนดตำแหน่งที่จะแสดง output
    • ฟังก์ชัน output มักมีรูปแบบดังนี้:
      <type>output(<identifying label>, ...)
      
  • โค้ดส่วนที่สองกำหนดไว้ภายในฟังก์ชัน server

    • มีรูปแบบดังนี้:
      output$<identifying label> <- render<type>(...)
      
การสร้างแดชบอร์ดด้วย shinydashboard

ตัวอย่าง: การศึกษาการนอนหลับ

  • นำเข้าชุดข้อมูลก่อน
    library(tidyverse)
    sleep <- read_csv("../data/Time Americans Spend Sleeping.csv")  
    
  • คอลัมน์ในชุดข้อมูล
    $ index                   : num [1:945] 0 1 2 3 4  ...
    $ Year                    : num [1:945] 2003 2004 2005 2006 2007 ...
    $ Period                  : chr [1:945] "Annual" "Annual" "Annual" "Annual" ...
    $ Avg hrs per day sleeping: num [1:945] 8.57 8.55 8.62 8.63  ...
    $ Standard Error          : num [1:945] 0.018 0.026 0.023 0.024  ...
    $ Type of Days            : chr [1:945] "All days" "All days" "All days" ...
    $ Age Group               : chr [1:945] "15 years and over" "15 years and over" ...
    $ Activity                : chr [1:945] "Sleeping" "Sleeping" "Sleeping" ...
    $ Sex                     : chr [1:945] "Both" "Both" "Both" ...
    
การสร้างแดชบอร์ดด้วย shinydashboard

textOutput

  • วาง textOutput ใน UI ก่อน
ui <- fluidPage(
  titlePanel("Sleeping habits in America"), 
  textOutput("textlabel"))

server <- function(input, output) {
}

shinyApp(ui, server)
การสร้างแดชบอร์ดด้วย shinydashboard

renderText

  • หากต้องการ render text output ให้วาง renderText ไว้ใน server
  • ต้องใช้สัญลักษณ์ output$
ui <- fluidPage(
  titlePanel("Sleeping habits in America"), 
  textOutput("textlabel"))

server <- function(input, output) { output$textlabel <- renderText("Sleep deprivation is a serious health issue in many major cities around the world.") }
shinyApp(ui, server)
การสร้างแดชบอร์ดด้วย shinydashboard

textOutput ที่ถูก render แล้ว

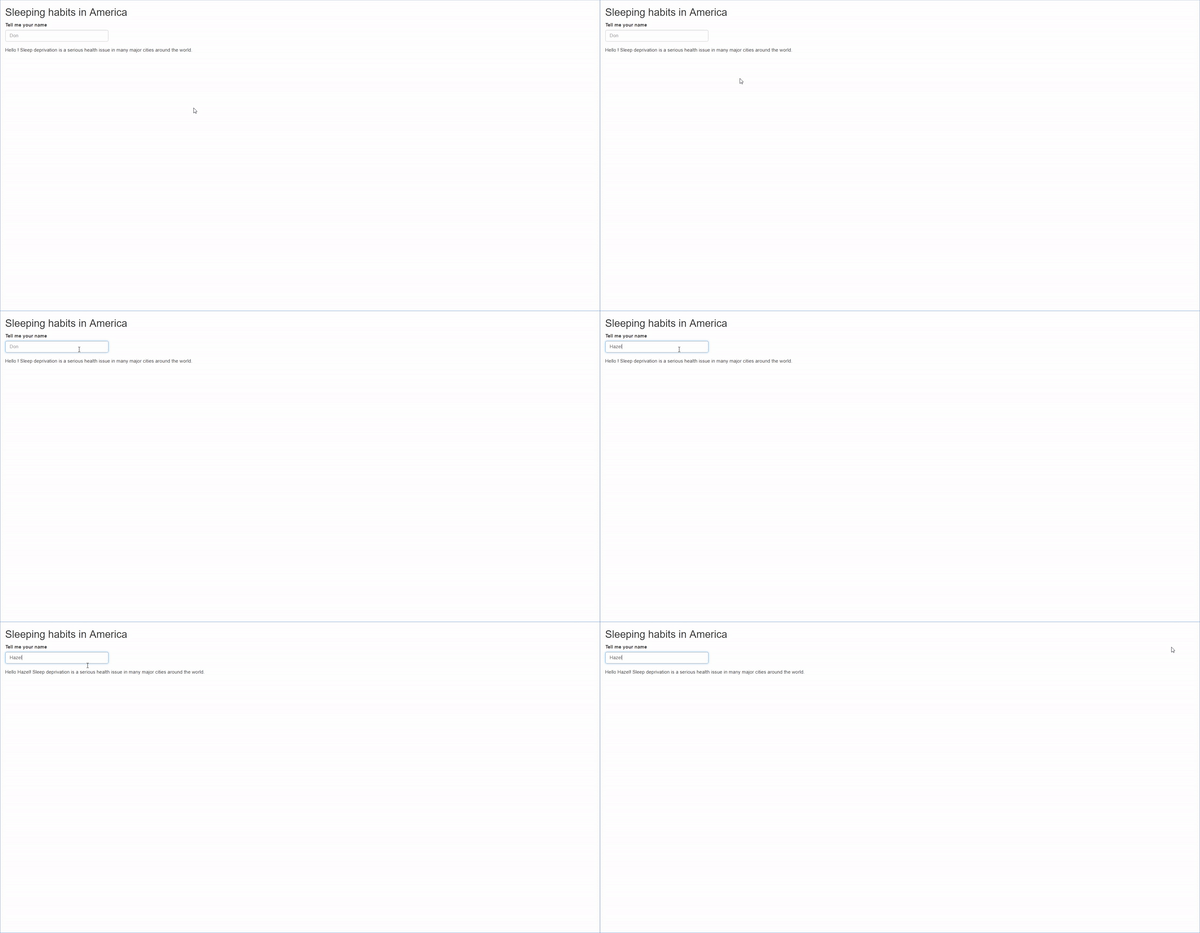
ตัวอย่าง text output โดยไม่มีการโต้ตอบกับ input

การสร้างแดชบอร์ดด้วย shinydashboard

textOutput พร้อมการโต้ตอบ

  • หากต้องการให้ input และ output โต้ตอบกัน ต้องเรียกใช้ input ผ่าน input$
input$<type>
การสร้างแดชบอร์ดด้วย shinydashboard

textOutput พร้อมการโต้ตอบ

  • ลองดูตัวอย่าง text input
ui <- fluidPage(
  titlePanel("Sleeping habits in America"), 

textInput("textlabel", "Tell me your name", value = "", placeholder = "Don"),
textOutput("textoutlabel")) server <- function(input, output) { output$textoutlabel <- renderText(paste0("Hello ",
input$textlabel,
"Sleep deprivation is a serious health issue in many major cities around the world.")) } shinyApp(ui, server)
การสร้างแดชบอร์ดด้วย shinydashboard

textOutput พร้อมการโต้ตอบ

ตัวอย่าง text output พร้อมการโต้ตอบ

การสร้างแดชบอร์ดด้วย shinydashboard

plotOutput

  • วาง plotOutput() ใน UI
ui <- fluidPage(
  titlePanel("Sleeping habits in America"), 

plotOutput("plotlabel"))
server <- function(input, output) { } shinyApp(ui, server)
การสร้างแดชบอร์ดด้วย shinydashboard

renderPlot

  • ต้องวาง renderPlot() ไว้ใน server()
ui <- fluidPage(
  titlePanel("Sleeping habits in America"), 
  plotOutput("plotlabel"))

server <- function(input, output) {

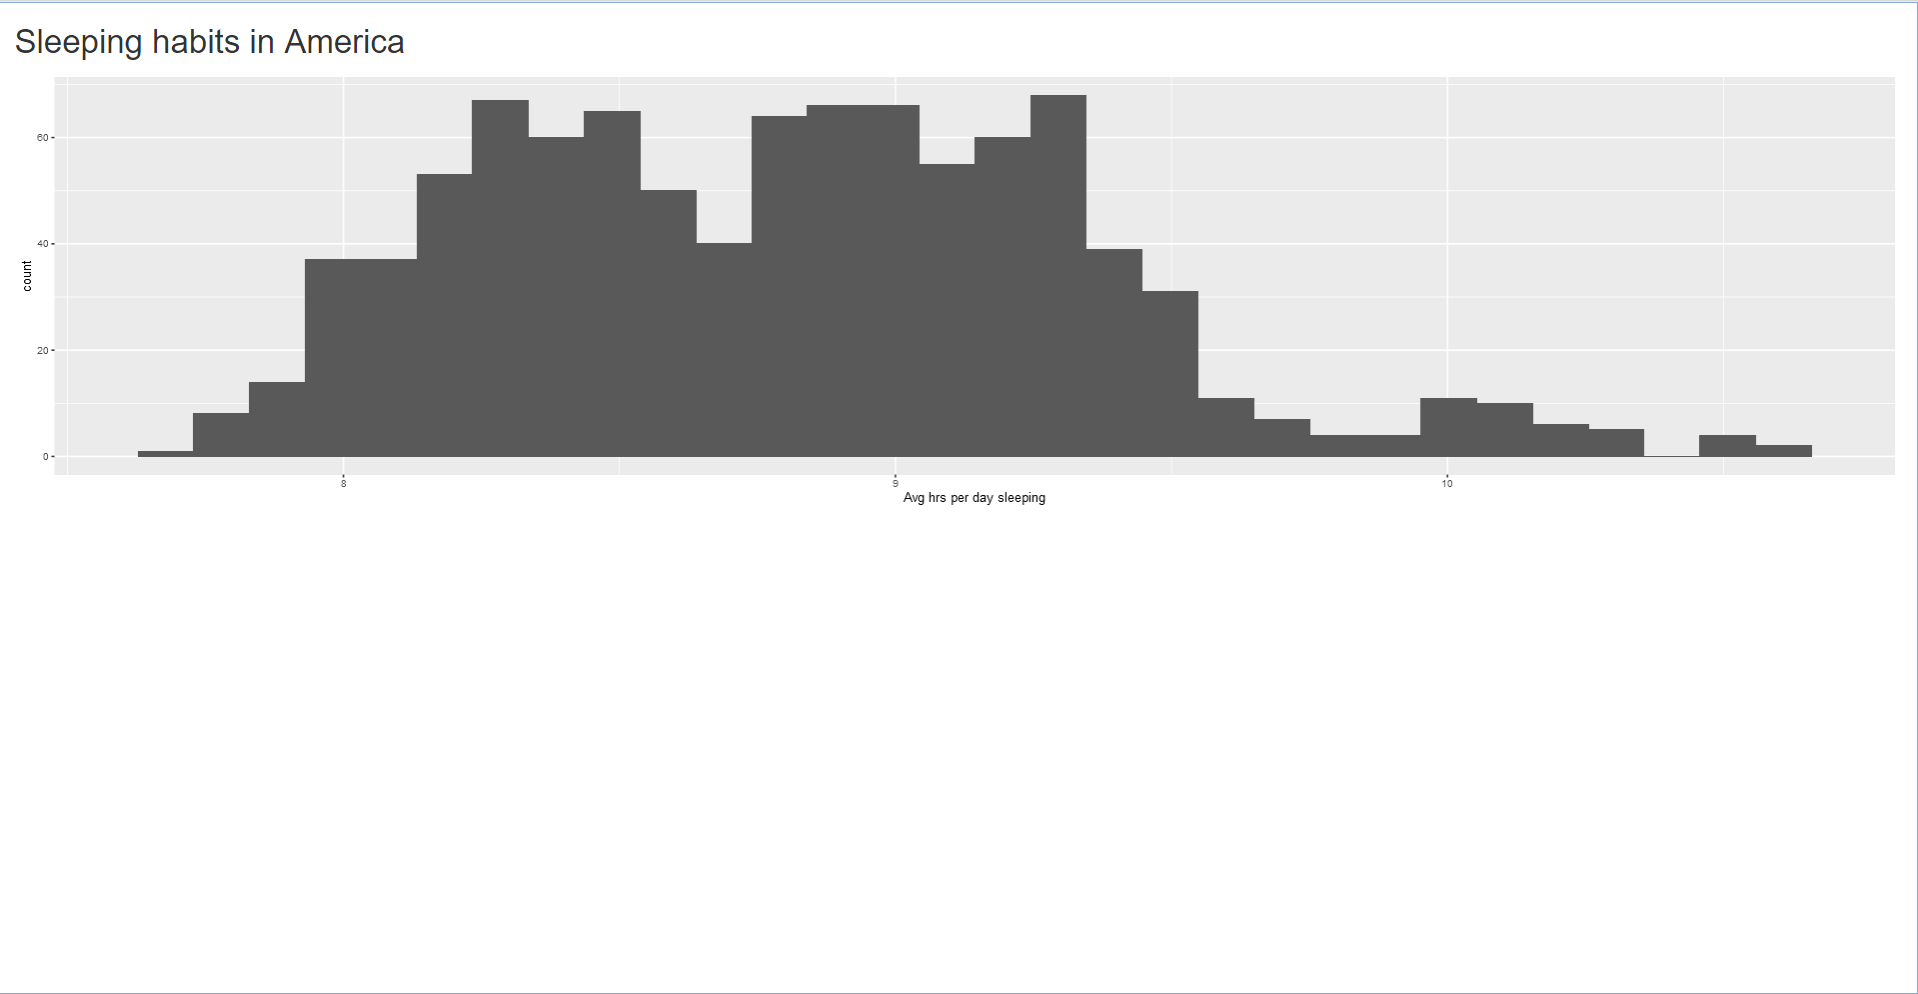
output$plotlabel <- renderPlot({ ggplot(sleep) + geom_histogram(aes(x = `Avg hrs per day sleeping`)) })
} shinyApp(ui, server)
การสร้างแดชบอร์ดด้วย shinydashboard

plotOutput ที่ถูก render แล้ว

ตัวอย่าง plotOutput

การสร้างแดชบอร์ดด้วย shinydashboard

plotOutput พร้อม selectInput

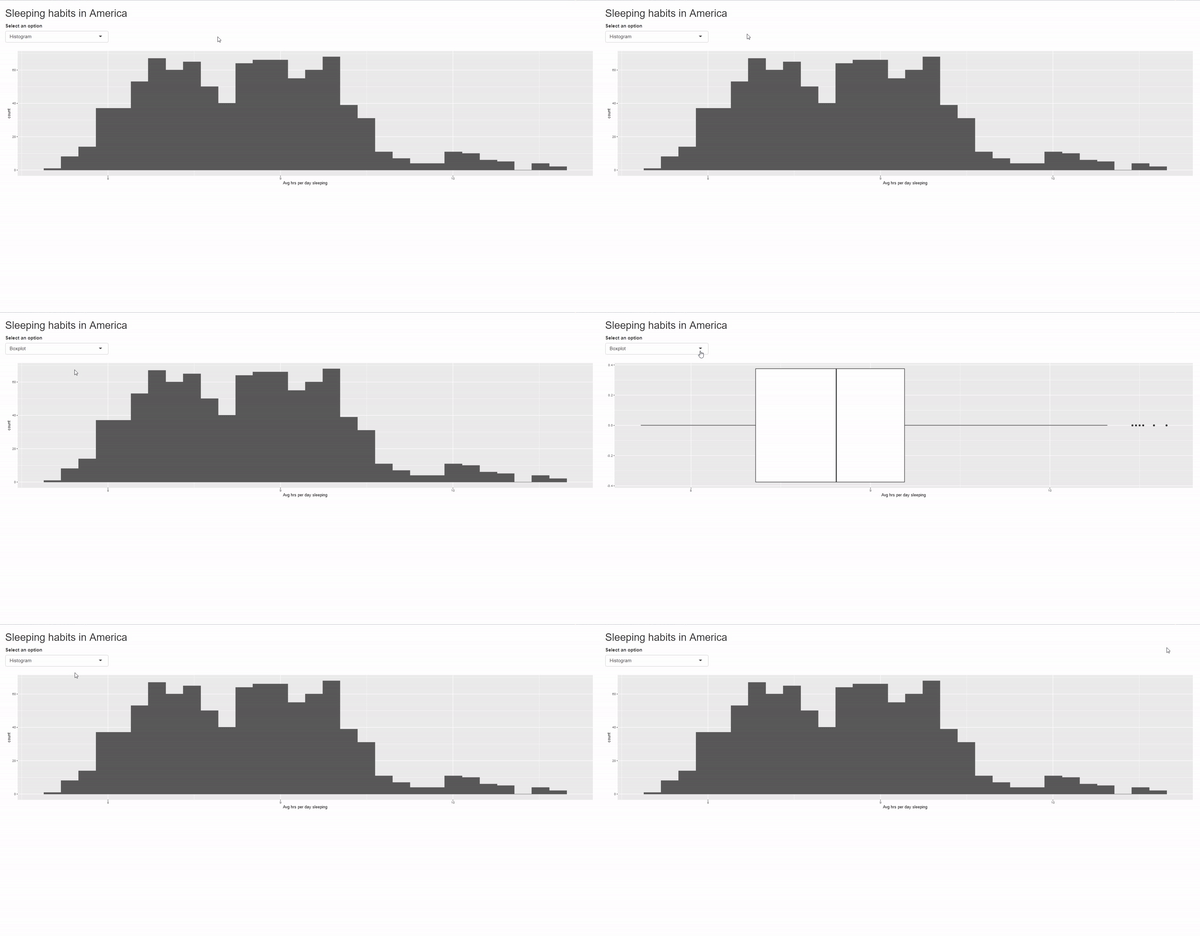
  • ใช้ input ของผู้ใช้เพื่อแสดงผลลัพธ์ที่แตกต่างกัน
ui <- fluidPage(
  titlePanel("Sleeping habits in America"), 
  selectInput("selectlabel", 
              "Select an option",
              choices = c("Histogram", "Boxplot")),
  plotOutput("plotlabel"))
การสร้างแดชบอร์ดด้วย shinydashboard

plotOutput พร้อม selectInput

server <- function(input, output) {
  output$plotlabel <- renderPlot({
    if (input$selectlabel == "Histogram"){

ggplot(sleep) + geom_histogram(aes(x = `Avg hrs per day sleeping`))
} else if (input$selectlabel == "Boxplot"){
ggplot(sleep) + geom_boxplot(aes(x = `Avg hrs per day sleeping`))
} }) } shinyApp(ui, server)
การสร้างแดชบอร์ดด้วย shinydashboard

plotOutput พร้อม selectInput

ตัวอย่าง plotOutput พร้อม selectInput

การสร้างแดชบอร์ดด้วย shinydashboard

plotOutput พร้อม sliderInput

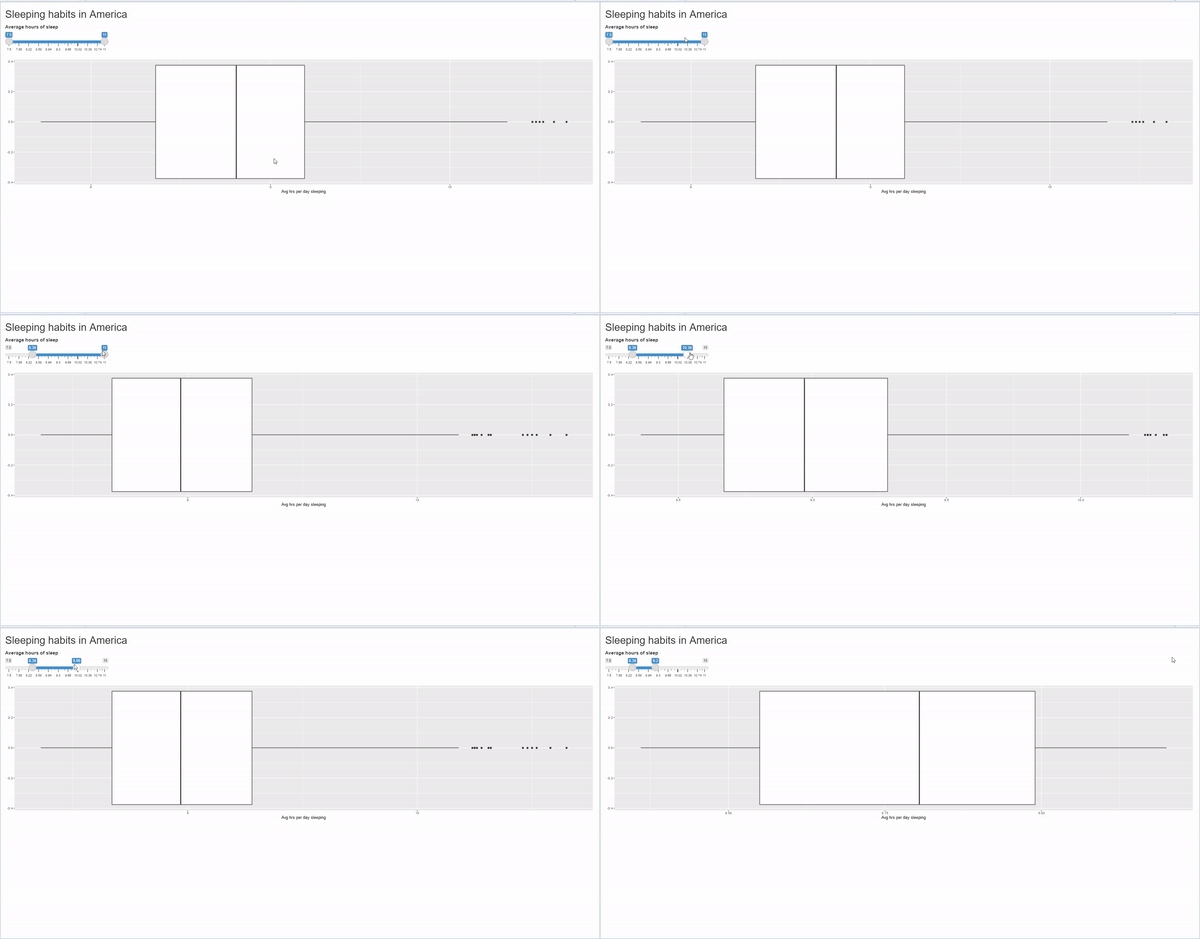
  • ลองดูตัวอย่างที่ใช้ sliderInput
ui <- fluidPage(
  titlePanel("Sleeping habits in America"), 

sliderInput("sliderlabel", "Average hours of sleep", min = 7.5, max = 11, value = c(7.5, 11), step = 0.02),
plotOutput("plotlabel")) server <- function(input, output) {
output$plotlabel <- renderPlot({ filter(sleep, `Avg hrs per day sleeping` >= input$sliderlabel[1], `Avg hrs per day sleeping` <= input$sliderlabel[2]) %>% ggplot() + geom_boxplot(aes(x=`Avg hrs per day sleeping`)) })
} shinyApp(ui, server)
การสร้างแดชบอร์ดด้วย shinydashboard

plotOutput พร้อม sliderInput

ตัวอย่าง plotOutput พร้อม sliderInput

การสร้างแดชบอร์ดด้วย shinydashboard

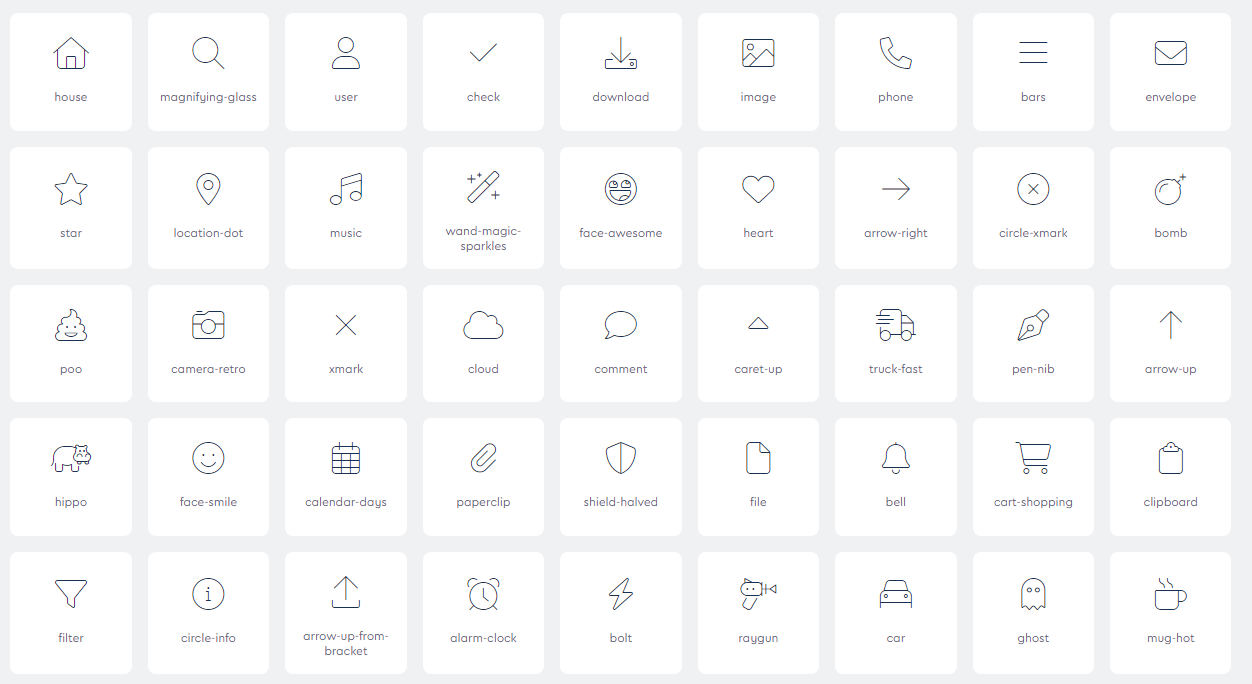
Icon ใน shiny

  • shiny มี icon ที่ใช้ใน shinyApp ได้

ตัวอย่าง icon บางส่วนใน shiny

1 https://fontawesome.com/icons
การสร้างแดชบอร์ดด้วย shinydashboard

Icon ใน shiny: ตัวอย่าง

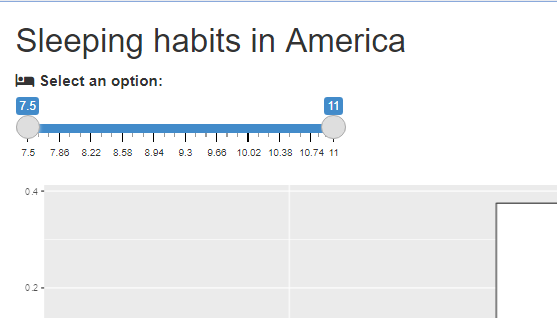
  • ใช้ icon("...")
  • กลับมาดูตัวอย่างก่อนหน้า
  • เช่น icon("bed")
ui <- fluidPage(
  titlePanel("Sleeping habits in America"), 
  sliderInput("sliderlabel",

list(icon("bed"),
"Select an option:"), min = 7.5, max = 11, value = c(7.5, 11), step = 0.02), plotOutput("plotlabel")) server <- function(input, output) { output$plotlabel <- renderPlot({ filter(sleep, `Avg hrs per day sleeping` >= input$sliderlabel[1], `Avg hrs per day sleeping` <= input$sliderlabel[2]) %>% ggplot() + geom_boxplot(aes(x=`Avg hrs per day sleeping`)) }) } shinyApp(ui, server)
การสร้างแดชบอร์ดด้วย shinydashboard

แอปที่ render แล้วพร้อม icon

ตัวอย่าง icon

การสร้างแดชบอร์ดด้วย shinydashboard

มาฝึกกันเถอะ!

การสร้างแดชบอร์ดด้วย shinydashboard

Preparing Video For Download...