แผนที่เชิงพื้นที่ด้วย sf

การสร้างแดชบอร์ดด้วย shinydashboard

Png Kee Seng

Researcher

แนะนำ sf

  • ใช้ sf สร้างแผนที่เชิงพื้นที่
    • ย่อมาจาก "simple features"
  • การสร้างภาพเชิงพื้นที่ด้วย sf จะสร้างเป็นเลเยอร์
    • เหมือนการวางเลเยอร์ทับกันทีละชั้น
    • เราจะไม่ลงลึกในหัวข้อนี้มากนัก

ฝีแปรงบนผืนผ้าใบเปล่า

1 Image by rawpixel.com on Freepik
การสร้างแดชบอร์ดด้วย shinydashboard

นำเข้าไลบรารีและข้อมูลเชิงพื้นที่

  • นำเข้า sf และ tidyverse
  • ใช้ st_read() และ st_as_sf() เพื่ออ่านไฟล์ keyhole markup language (KML)
    • london_poly: ขอบเขต เชิงพื้นที่ของลอนดอน
    • london_loop: เส้นทาง วงกลม (โดยประมาณ) รอบลอนดอน
    • london_capital: เส้นทาง วงกลมเชื่อมพื้นที่ใจกลางลอนดอน
    • listings_geo: พิกัด ของที่พัก Airbnb
library(sf)
library(tidyverse)
london_poly <- st_read("../data/london_boroughs_boroughs_kml.kml",
                            drivers = "KML", quiet=TRUE)
london_loop <- st_read("../data/London-Loop-SWC-Walk-L24.kml",
                       drivers = "KML", quiet=TRUE)
london_capital <- st_read("../data/Capital-Ring-SWC-Walk-L23.kml",
                          drivers="KML", quiet=TRUE)
listings_geo <- st_as_sf(listings,
                         coords = c("longitude", "latitude"))
การสร้างแดชบอร์ดด้วย shinydashboard

ประเภทของออบเจกต์ sf: MULTIPOLYGON

london_poly$geometry
Geometry set for 33 features 
Geometry type: MULTIPOLYGON

Dimension: XY Bounding box: xmin: -0.508813 ymin: 51.28691 ... Geodetic CRS: WGS 84 First 5 geometries: MULTIPOLYGON (((-0.183361 51.66868, -0.183383 5... MULTIPOLYGON (((0.158044 51.50904, 0.156309 51.... MULTIPOLYGON (((-0.212138 51.55558, -0.212689 5... MULTIPOLYGON (((0.076463 51.431, 0.075932 51.43... MULTIPOLYGON (((-0.140804 51.56946, -0.14081 51...

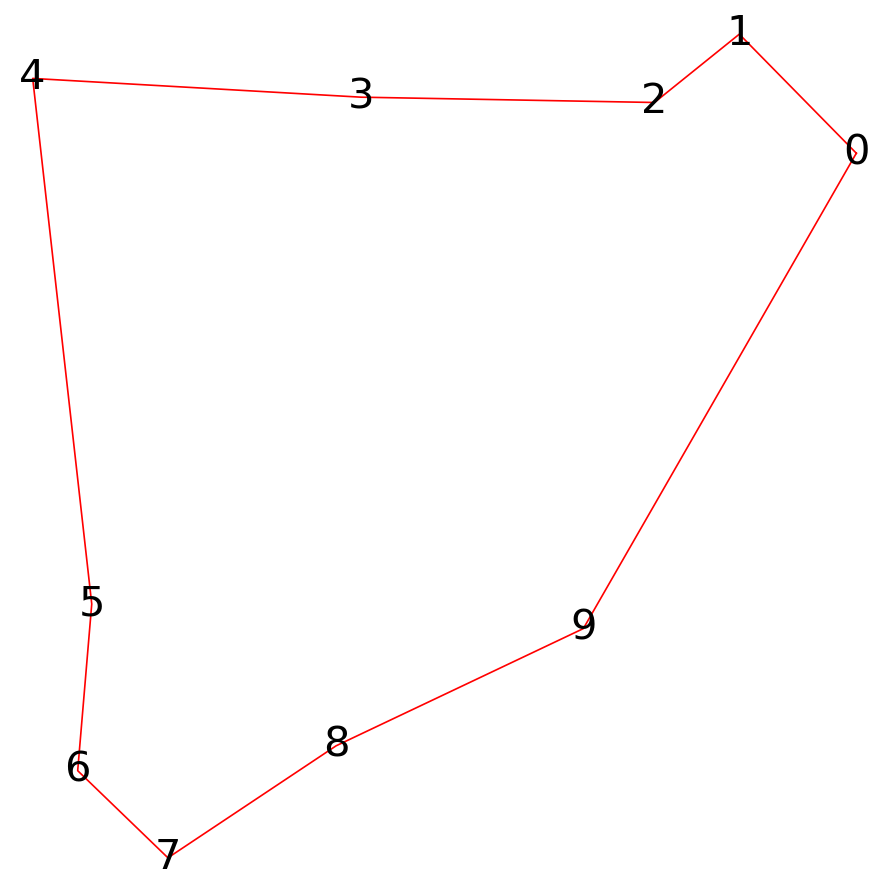
รูปหลายเหลี่ยมสุ่มที่มี 10 ด้าน

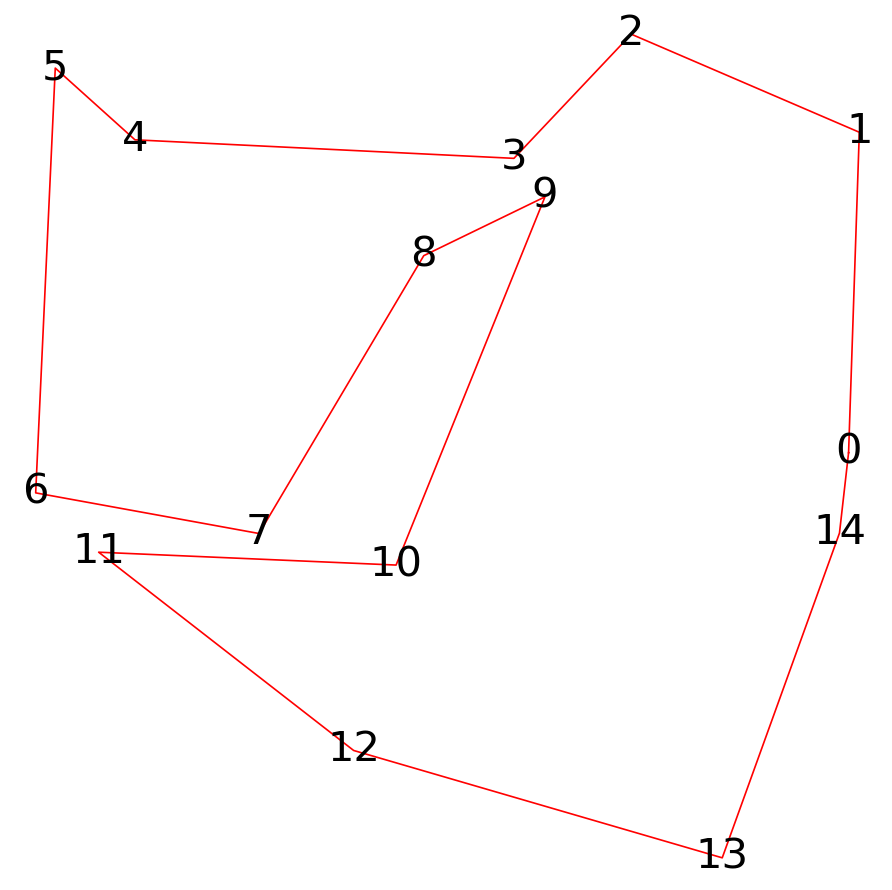
รูปหลายเหลี่ยมสุ่มที่มี 15 ด้าน

การสร้างแดชบอร์ดด้วย shinydashboard

ประเภทของออบเจกต์ sf: LINESTRING

london_loop$geometry
Geometry set for 1 feature 
Geometry type: LINESTRING
Dimension:     XYZ
Bounding box:  xmin: -0.499406 ymin: 51.29375 xmax: 0.257656 ymax: 51.67563
z_range:       zmin: 0 zmax: 174
Geodetic CRS:  WGS 84
LINESTRING Z (0.236477 51.48095 1, 0.235149 51....

เช่นเดียวกันสำหรับ london_capital

การสร้างแดชบอร์ดด้วย shinydashboard

ประเภทของออบเจกต์ sf: POINT

listings_geo$geometry
Geometry set for 69351 features 
Geometry type: POINT
Dimension:     XY
Bounding box:  xmin: -0.5236 ymin: 51.27248 xmax: 0.30515 ymax: 51.70893
CRS:           NA
First 5 geometries:
POINT (-0.05396 51.52874)
POINT (-0.1127 51.56861)
POINT (-0.07426 51.52851)
POINT (-0.10484 51.52478)
POINT (-0.20004 51.51464)
การสร้างแดชบอร์ดด้วย shinydashboard

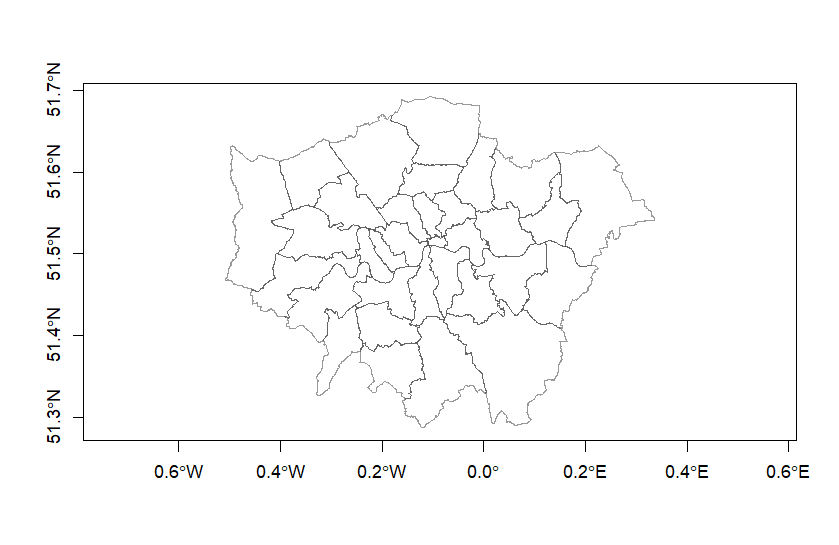
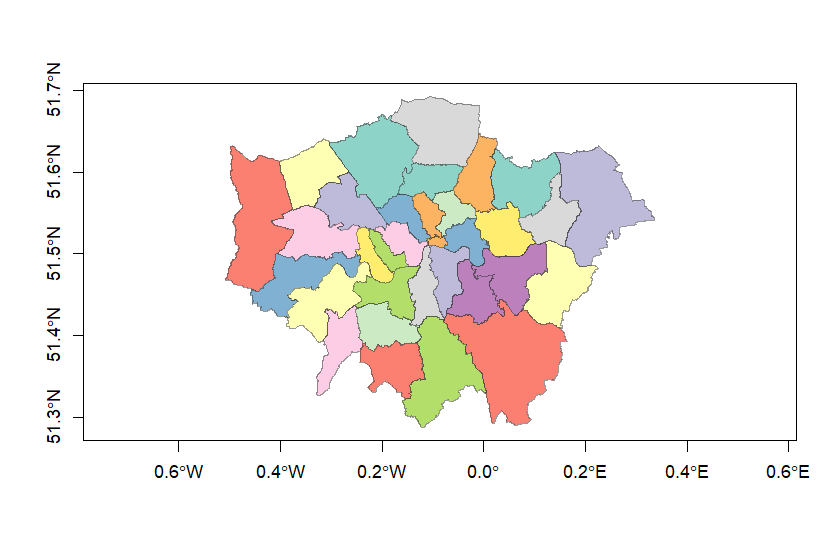
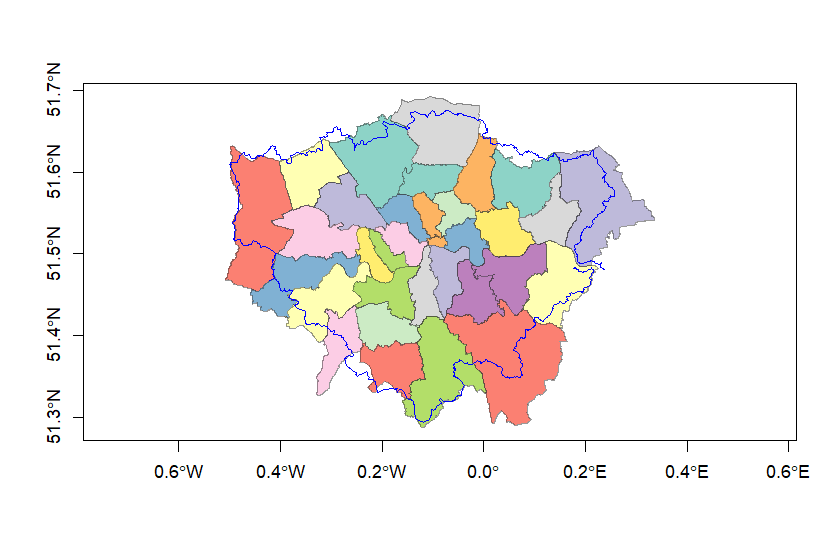
พล็อตรูปหลายเหลี่ยมด้วย plot()

  • ใช้ st_geometry() สร้างรูปหลายเหลี่ยม
  • ใช้ plot()
  • กำหนดสีแต่ละรูปหลายเหลี่ยมด้วย col
plot(st_geometry(london_poly), axes=TRUE, 
                border=grey(0.2, 0.5))
plot(st_geometry(london_poly), 
        col = sf.colors(length(london_poly$Name), 
                        categorical = TRUE), 
        axes=TRUE, border=grey(0.2, 0.5))

กราฟ multi-polygon ที่ไม่มีการระบายสี

กราฟ multi-polygon ที่มีการระบายสี

การสร้างแดชบอร์ดด้วย shinydashboard

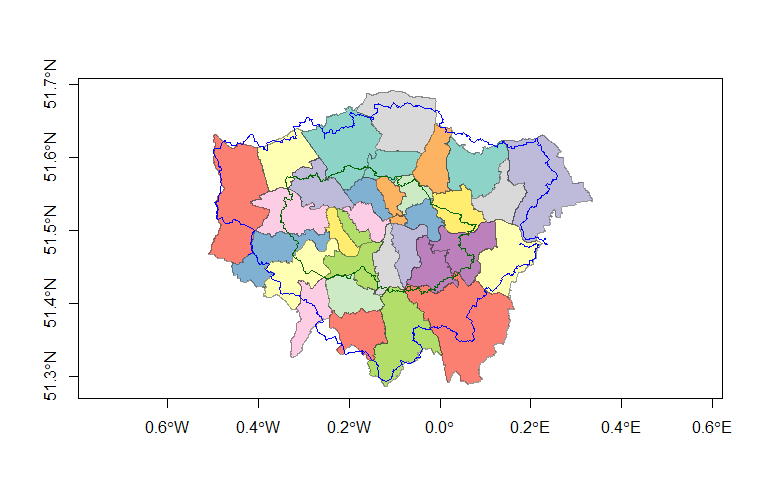
พล็อตเส้นด้วย plot()

  • ใช้ st_geometry() สร้าง polyline สำหรับ london_loop
    • กำหนด add เป็น TRUE
    • เปลี่ยน col เป็นสีน้ำเงิน
  • ทำแบบเดียวกันสำหรับ london_capital
plot(st_geometry(london_loop),

add=TRUE,
col="blue")
plot(st_geometry(london_capital), add=TRUE, col="darkgreen")

แผนที่ที่มีเส้นทางวงกลมหนึ่งเส้น

แผนที่ที่มีเส้นทางวงกลมสองเส้น

การสร้างแดชบอร์ดด้วย shinydashboard

พล็อตจุดด้วย plot()

  • เพิ่มจุดด้วย st_geometry()
    plot(st_geometry(listings_geo), add=TRUE, col='red')
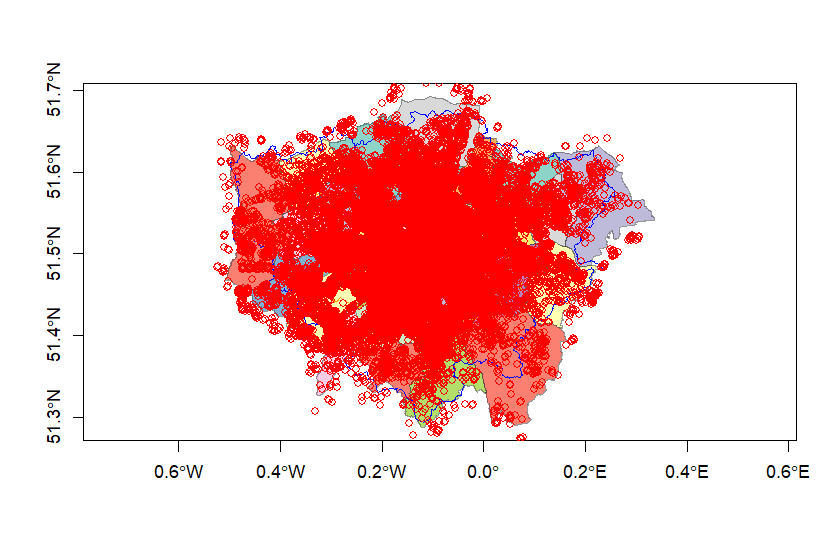
    

พล็อตจุด sf

การสร้างแดชบอร์ดด้วย shinydashboard

พล็อตรูปหลายเหลี่ยมด้วย ggplot()

  • ใช้ ggplot() พล็อตเลเยอร์ของ sf ได้
  • ต้องปรับ coordinate reference system (CRS) ของทั้งสองเลเยอร์ให้ตรงกัน
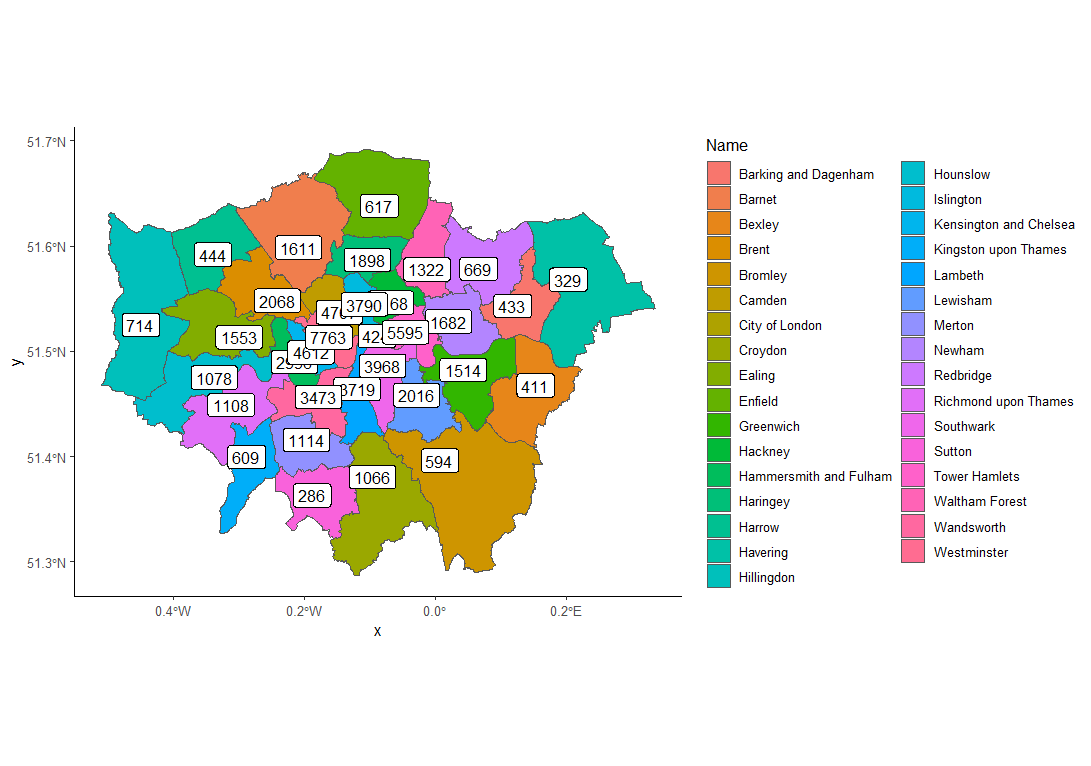
แผนที่เชิงพื้นที่ที่สร้างด้วย ggplot

num_listings <- listings %>% 
  group_by(neighbourhood) %>%
  summarize(`Number of listings` = n(),
            longitude = mean(longitude),
            latitude = mean(latitude),
            .groups = "drop") %>%

st_as_sf(coords = c("longitude", "latitude"))
st_crs(num_listings) <- st_crs(london_poly)
ggplot_map <- ggplot(london_poly) + geom_sf(aes(fill = Name)) +
geom_sf_label(data=num_listings, aes(label=`Number of listings`)) + theme_classic()
การสร้างแดชบอร์ดด้วย shinydashboard

มาฝึกกันเถอะ!

การสร้างแดชบอร์ดด้วย shinydashboard

Preparing Video For Download...