การแมปพื้นที่รูปหลายเหลี่ยม

Interactive Maps with leaflet in R

Rich Majerus

Vice President of Strategy & Planning, Queens University of Charlotte

การพล็อตรูปหลายเหลี่ยม

shp %>% 
  leaflet() %>% 
  addTiles() %>% 
  addPolygons()
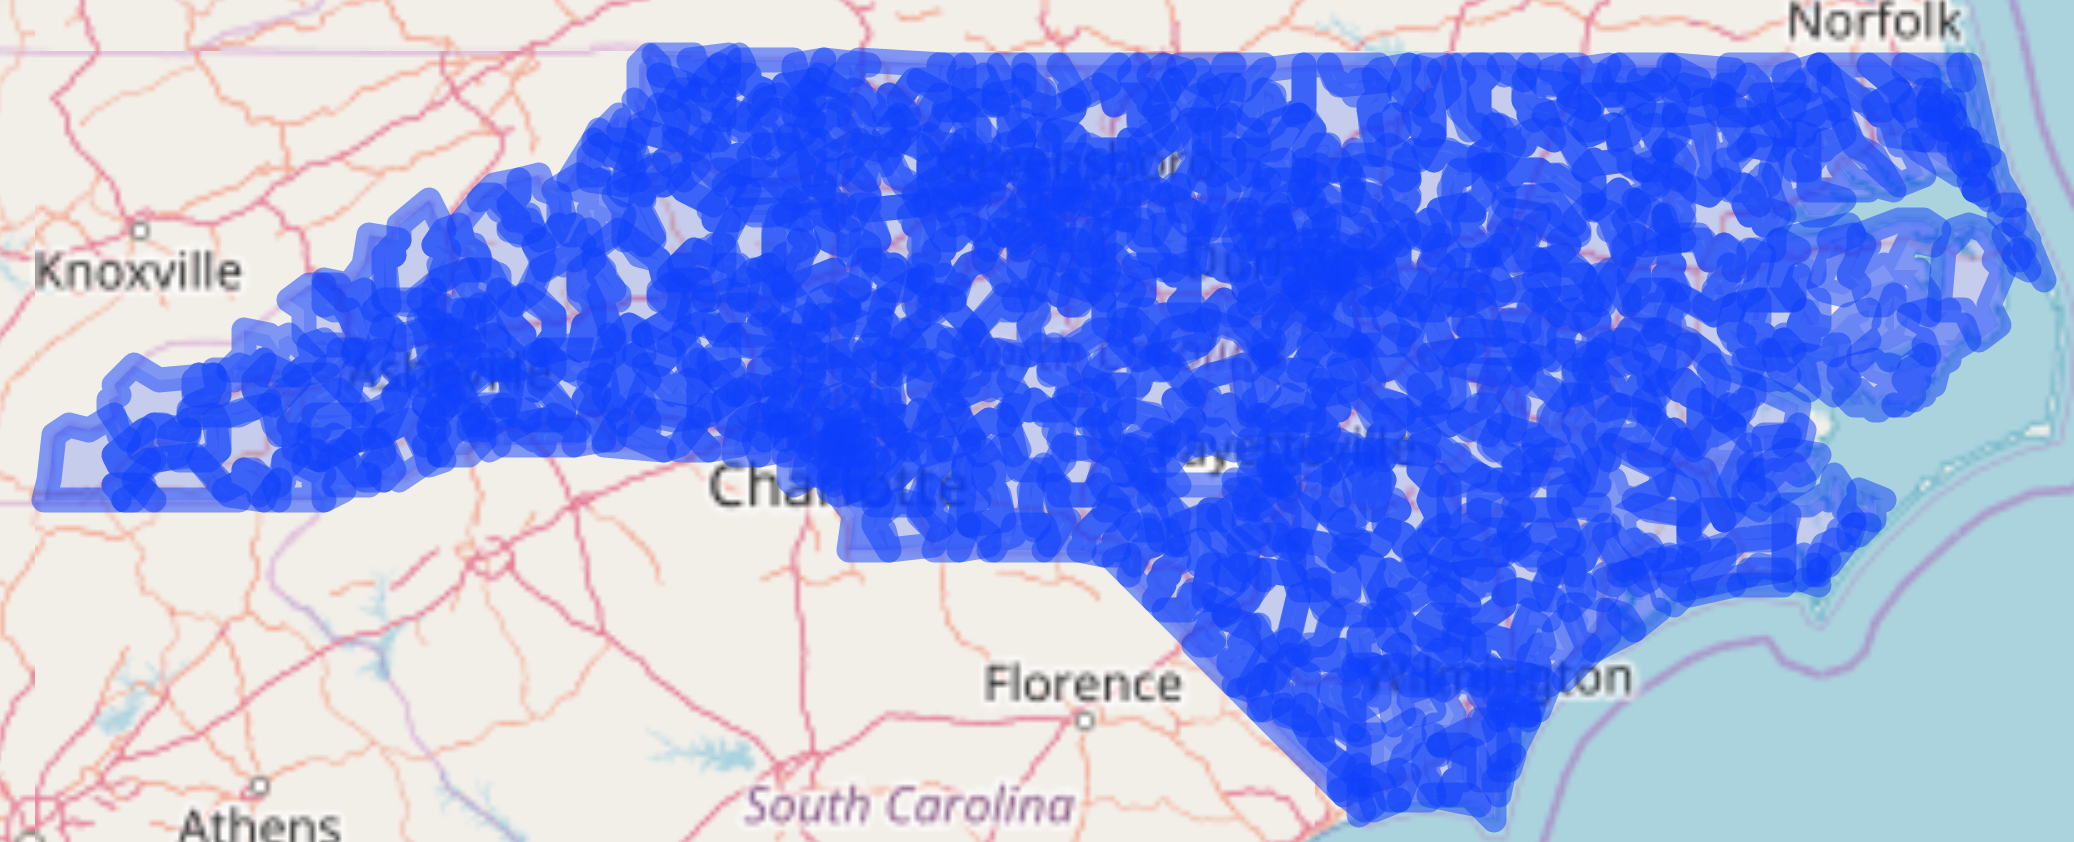
รูปหลายเหลี่ยมรหัสไปรษณีย์ทั้งหมดใน NC

Interactive Maps with leaflet in R

addPolygons()

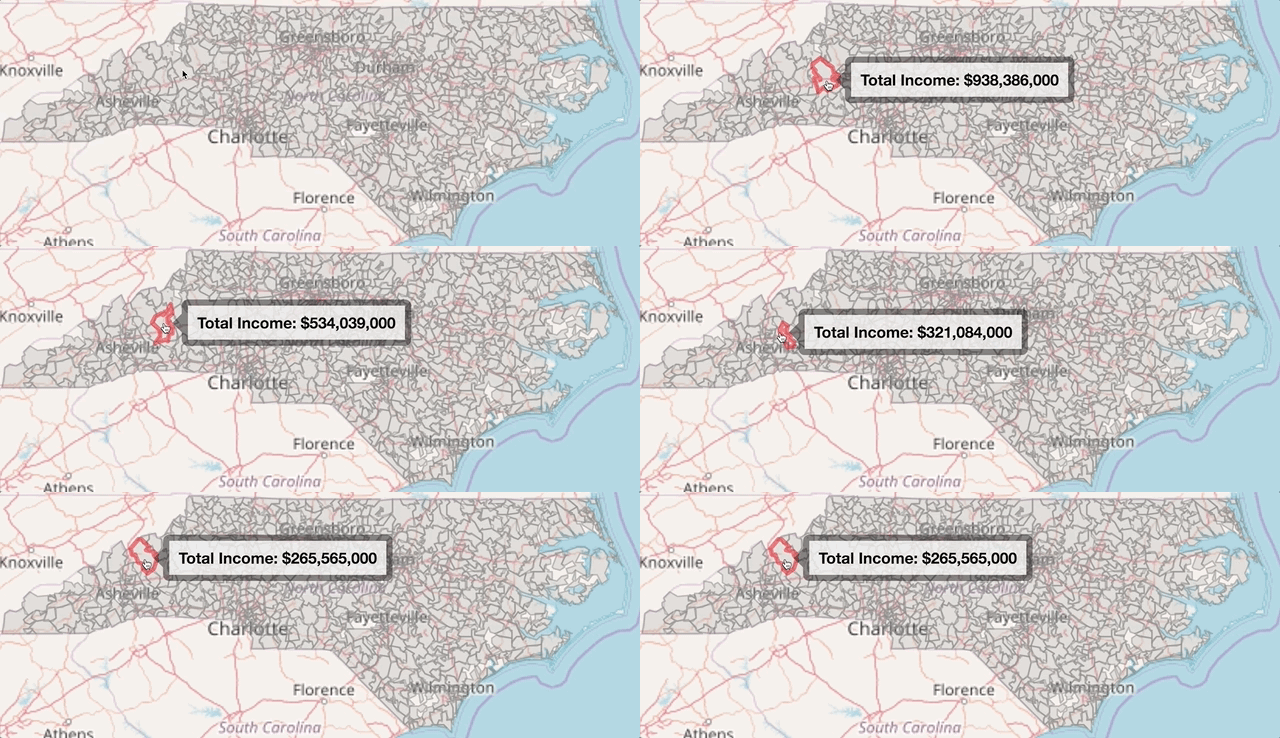
  • weight - ความหนาของเส้นขอบในหน่วยพิกเซล
  • color - สีของรูปหลายเหลี่ยม
  • label - ข้อมูลที่แสดงเมื่อวางเมาส์ไว้
  • highlight - ตัวเลือกสำหรับไฮไลต์รูปหลายเหลี่ยมเมื่อวางเมาส์ไว้
shp %>% 
leaflet() %>% 
addTiles() %>% 
addPolygons(weight = 1,
            color = "grey",
            label = ~paste0("Total Income: " dollar(income)),
            highlight = highlightOptions(weight = 3, color = "red",
                                         bringToFront = TRUE))
Interactive Maps with leaflet in R

addPolygons()

รูปหลายเหลี่ยมรหัสไปรษณีย์ทั้งหมดใน NC 2

Interactive Maps with leaflet in R

การกำหนดสีให้ข้อมูลตัวเลข

  • colorNumeric

    nc_pal <- colorNumeric(palette = "Blues", 
                           domain = high_inc@data$mean_income)
    
  • colorBin

    nc_pal <- colorBin(palette = "YlGn", bins = 5,
                       domain = high_inc@data$mean_income)
    
  • colorQuantile

    nc_pal <- colorQuantile(palette = "YlGn", n = 4, 
                            domain = high_inc@data$mean_income)
    
Interactive Maps with leaflet in R

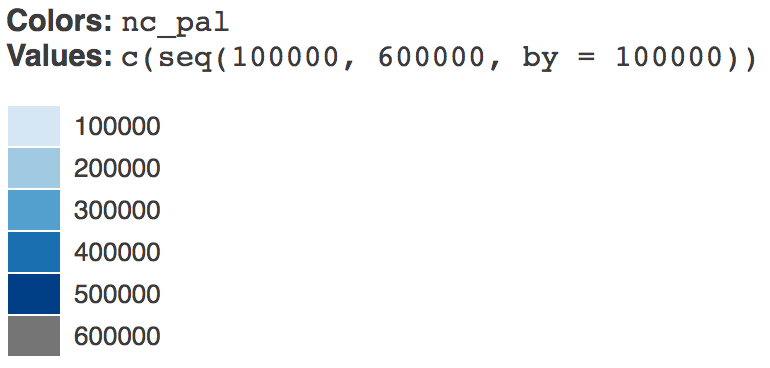
colorNumeric()

nc_pal <- colorNumeric("Blues", domain = high_inc@data$mean_income)

previewColors(pal = nc_pal, values = c(seq(100000, 600000, by = 100000)))
previewColors()

Interactive Maps with leaflet in R

แผนที่ Choropleth

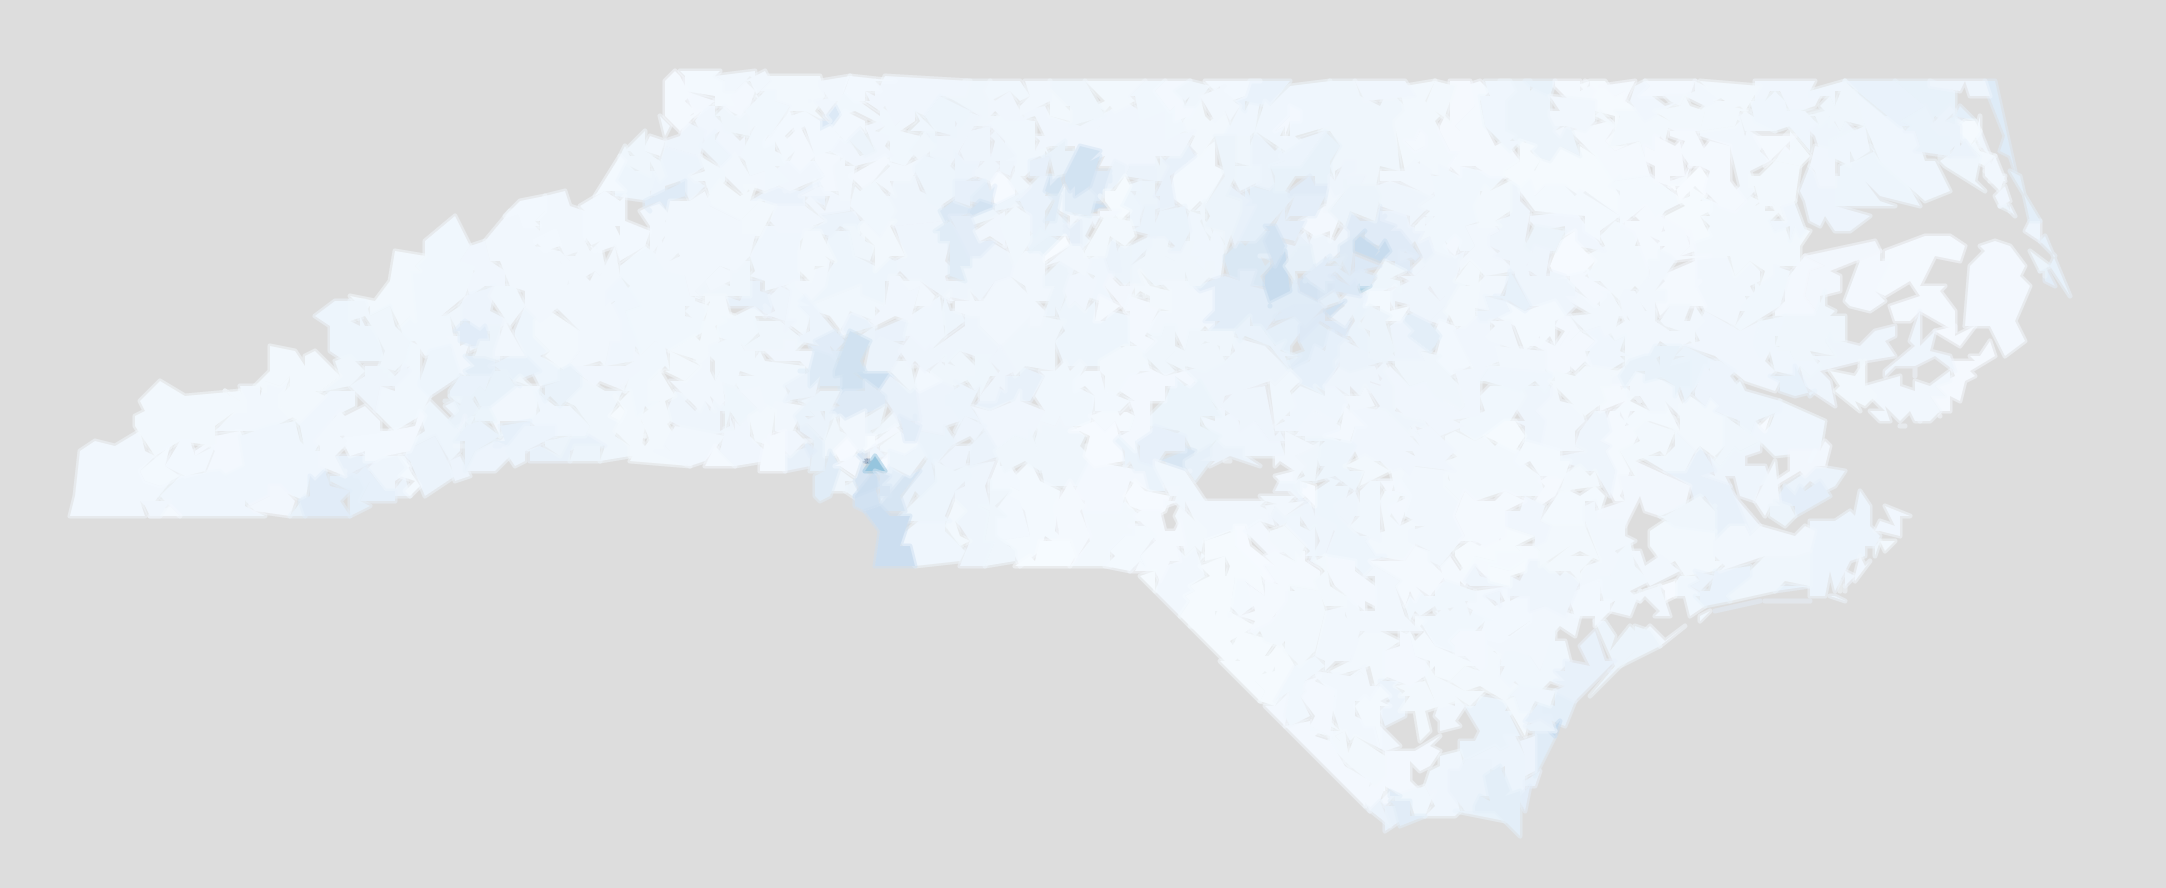
nc_pal <- colorNumeric(palette = "Blues", 
                       domain = shp@data$mean_income)

shp %>% leaflet() %>% addTiles() %>% addPolygons(weight = 1, fillOpacity = 1, color = ~nc_pal(mean_income), label = ~paste0("Mean Income: ", dollar(mean_income)), highlight = highlightOptions(weight = 3, color = "red", bringToFront = TRUE))
Interactive Maps with leaflet in R

แผนที่ Choropleth

แผนที่ Choropleth รายได้ใน NC

Interactive Maps with leaflet in R

ตัวอย่างแผนที่ Choropleth

ggplot(shp@data,
       aes(mean_income)) +
  geom_histogram()
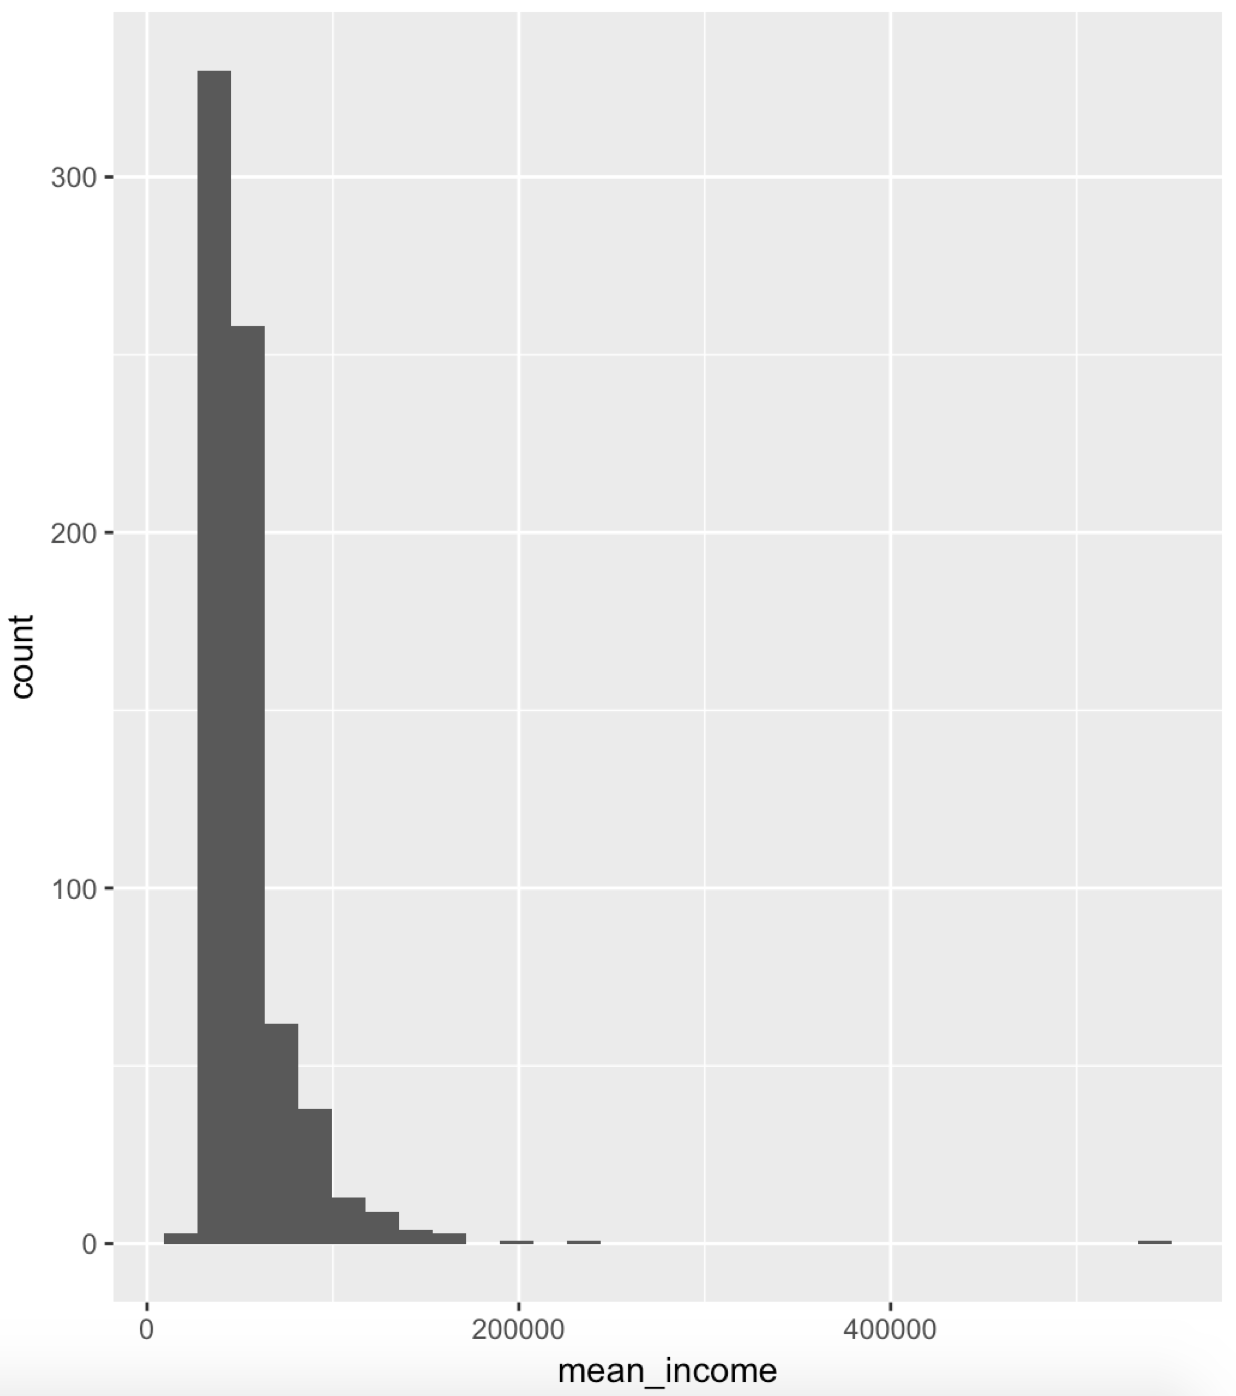
ฮิสโทแกรมรายได้

ggplot(shp@data, 
        aes(log(mean_income))) +
  geom_histogram()
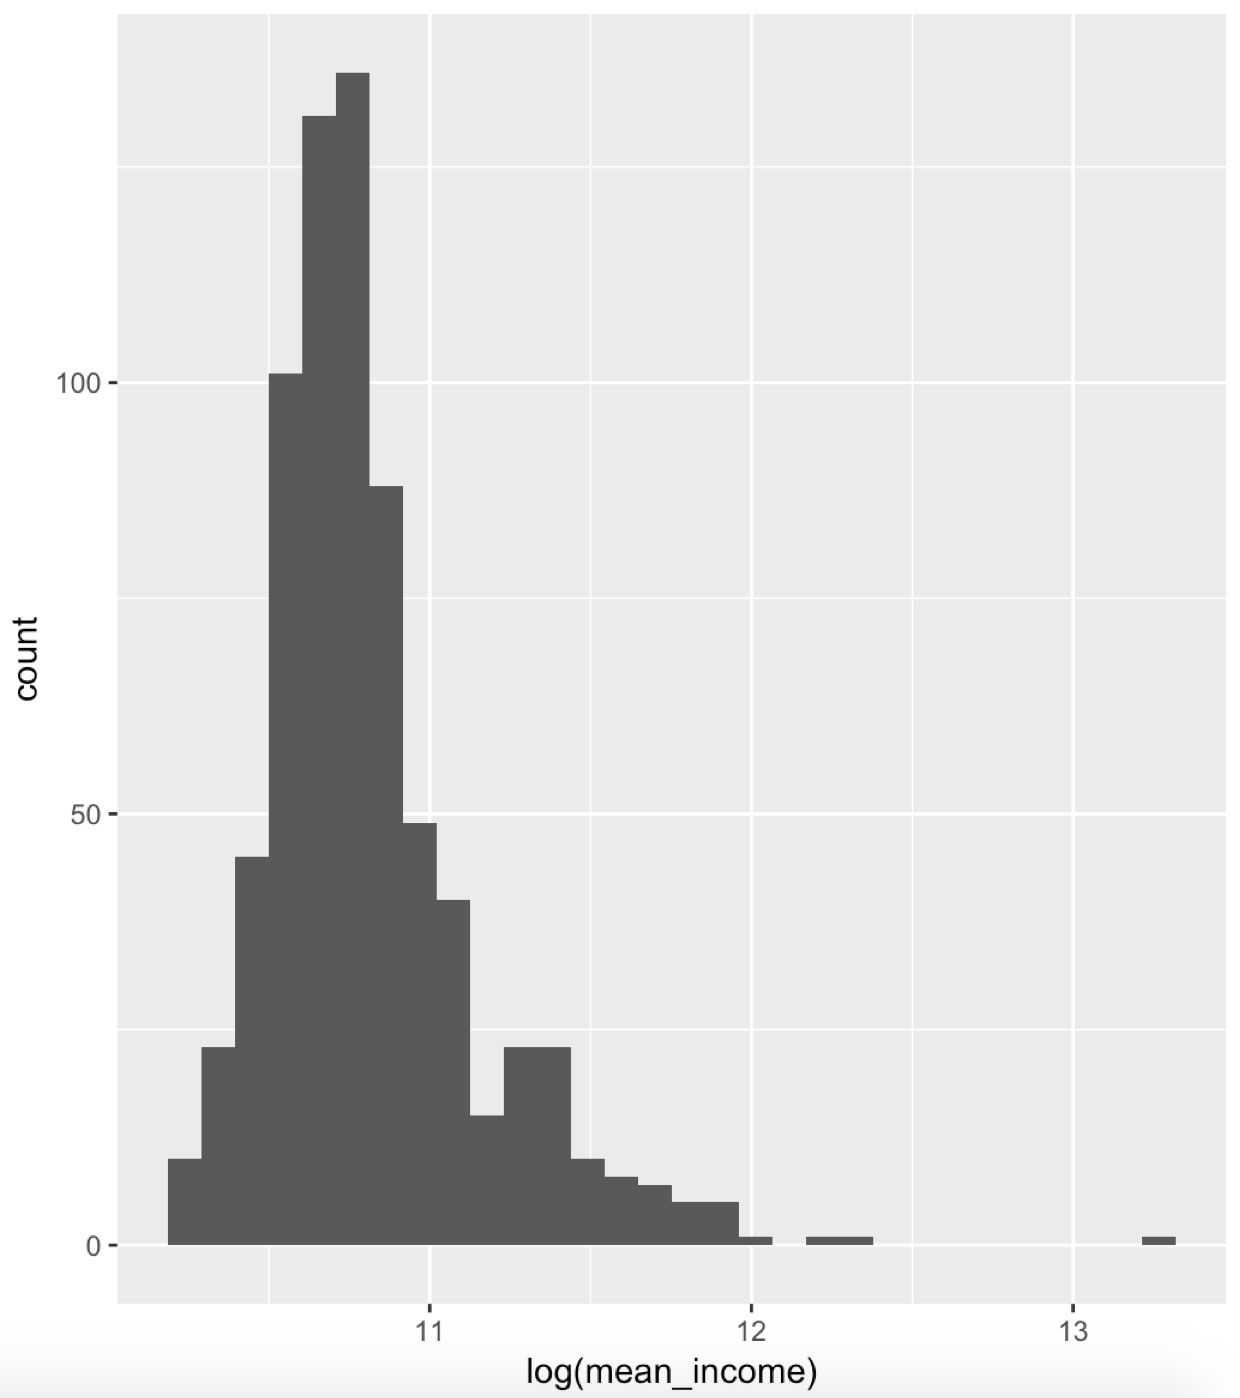
ฮิสโทแกรมรายได้แบบ log

Interactive Maps with leaflet in R

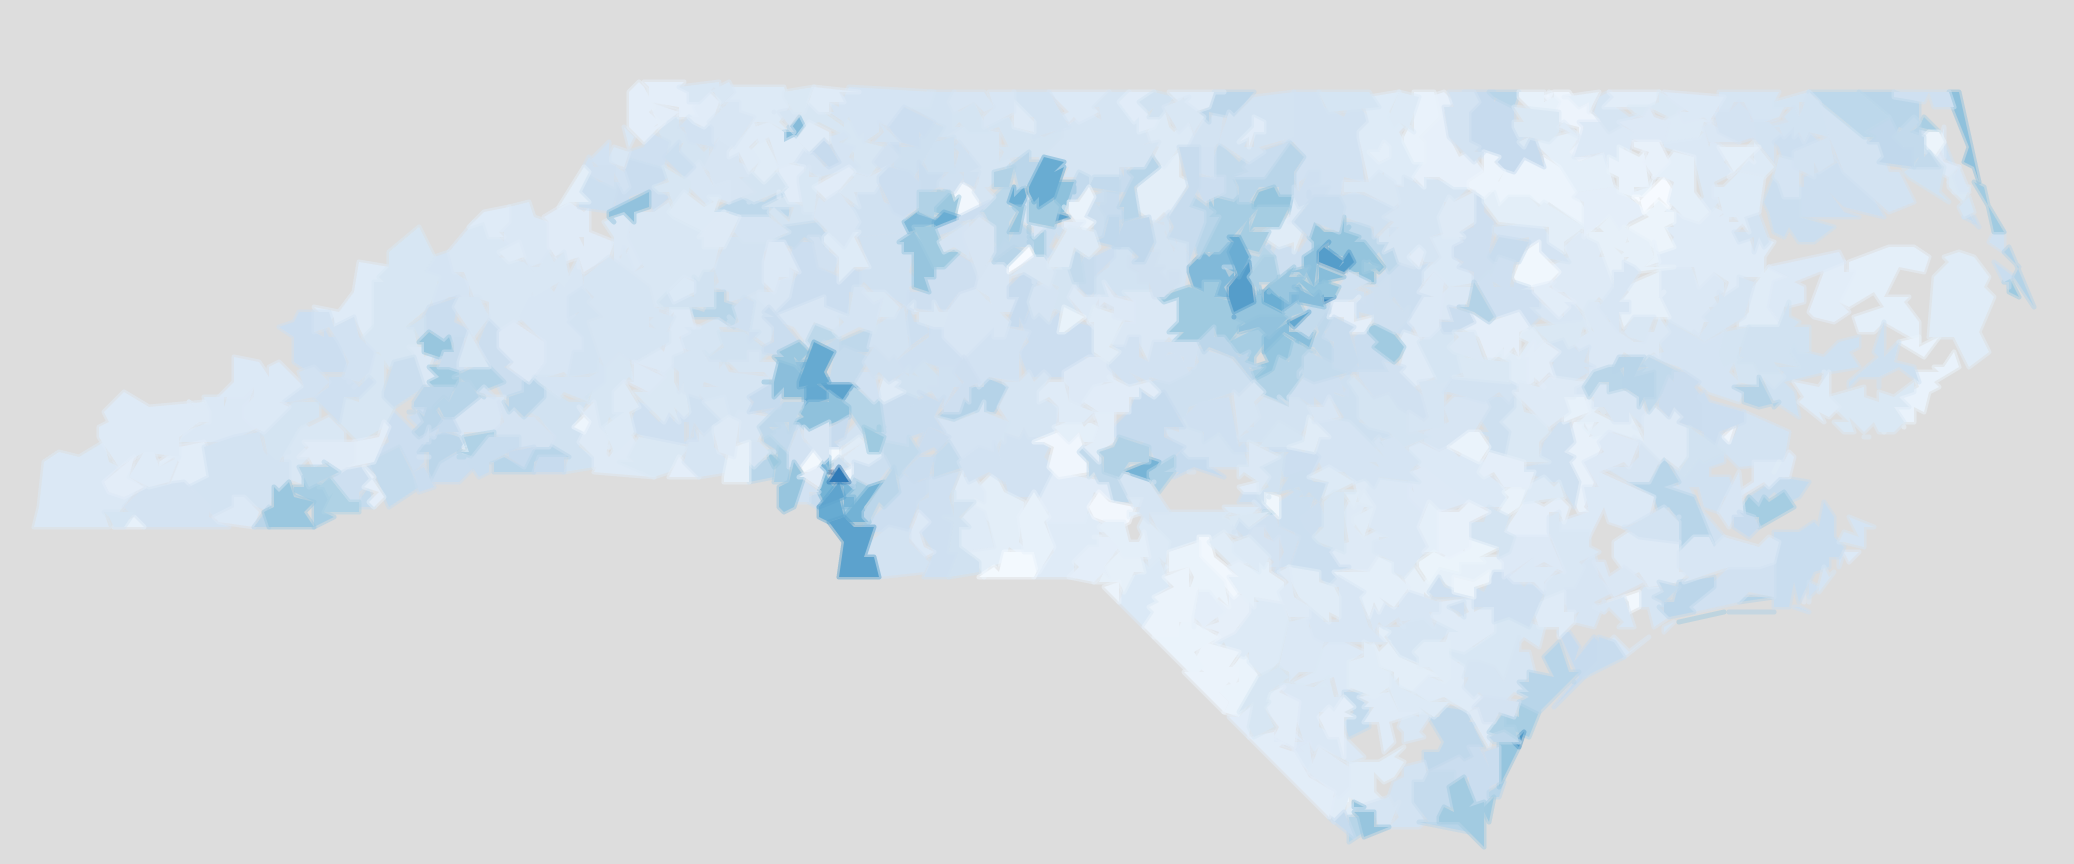
การใช้ Log

แผนที่ Choropleth รายได้แบบ log ใน NC

Interactive Maps with leaflet in R

มาฝึกกันเถอะ!

Interactive Maps with leaflet in R

Preparing Video For Download...