การกำหนดมุมมองแผนที่เริ่มต้น

Interactive Maps with leaflet in R

Rich Majerus

Vice President of Strategy & Planning, Queens University of Charlotte

Geocoding ใน R

  • วิธีที่นิยมใช้คือฟังก์ชัน geocode() ในแพ็กเกจ ggmap
  • คืนค่าละติจูดและลองจิจูดของที่อยู่หรือชื่อสถานที่
library(ggmap)

geocode("350 5th Ave, New York, NY 10118")
Information from URL : https://maps.googleapis.com/maps/api/geocode/...

lon       lat
-73.98575 40.74856
Interactive Maps with leaflet in R

Geocoding ใน R II

geocode(location, 
        output = c("latlon", "latlona", "more", "all"),
        source = c("google", "dsk"))

geocode("Colby College", output = "more", source = "google")
lon       lat      type          loctype  
-69.66264 44.56387 establishment rooftop  

address
4000 mayflower hill dr, waterville, me 04901, usa
Interactive Maps with leaflet in R

การกำหนดมุมมองแผนที่เริ่มต้น

setView()

leaflet() %>% 
 addTiles() %>% 
 setView(lng = -73.98575, 
         lat = 40.74856, 
         zoom = 13)
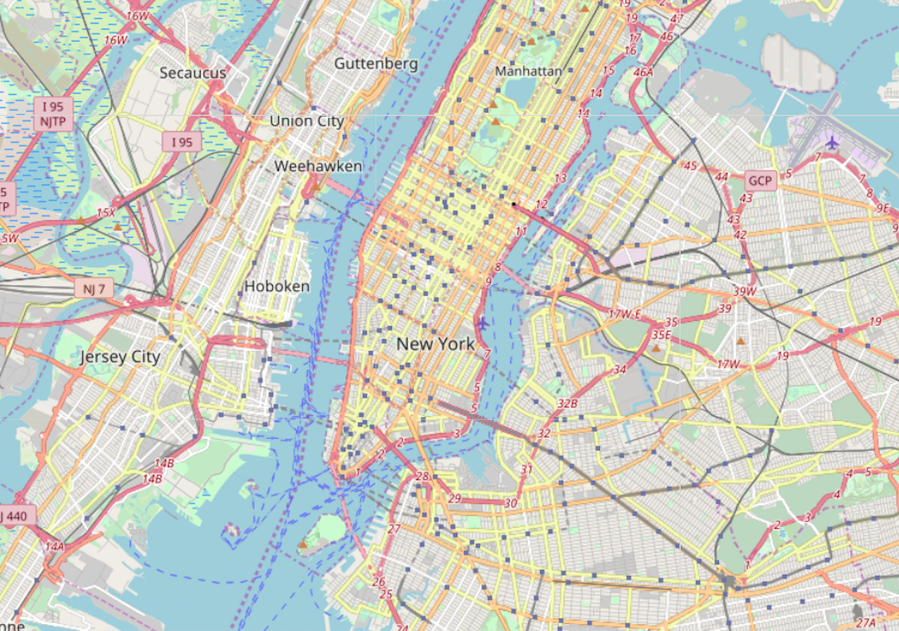
ตัวอย่างการใช้ setView()

fitBounds()

leaflet() %>% 
 addTiles() %>% 
 fitBounds(
  lng1 = -73.910, lat1 = 40.773, 
  lng2 = -74.060, lat2 = 40.723)
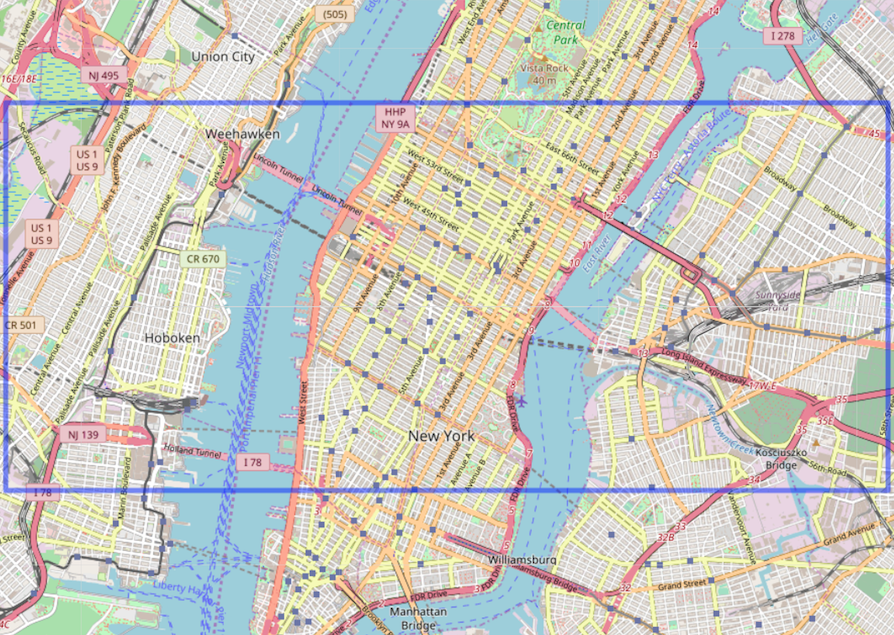
ตัวอย่างการใช้ fitBounds()

Interactive Maps with leaflet in R

การล็อกโฟกัสแผนที่

leaflet(options = leafletOptions(dragging = FALSE,
                                 minZoom = 14, 
                                 maxZoom = 18))  %>% 
    addProviderTiles("CartoDB")  %>% 
    setView(lng = -73.98575, lat = 40.74856, zoom = 18)

Interactive Maps with leaflet in R

การคืนโฟกัสแผนที่

leaflet()  %>% 
     addTiles()  %>% 
     setView(lng = -73.98575, lat = 40.74856, zoom = 18) %>% 
     setMaxBounds(lng1 = -73.98575, lat1 = 40.74856, 
                  lng2 = -73.98575, lat2 = 40.74856) 
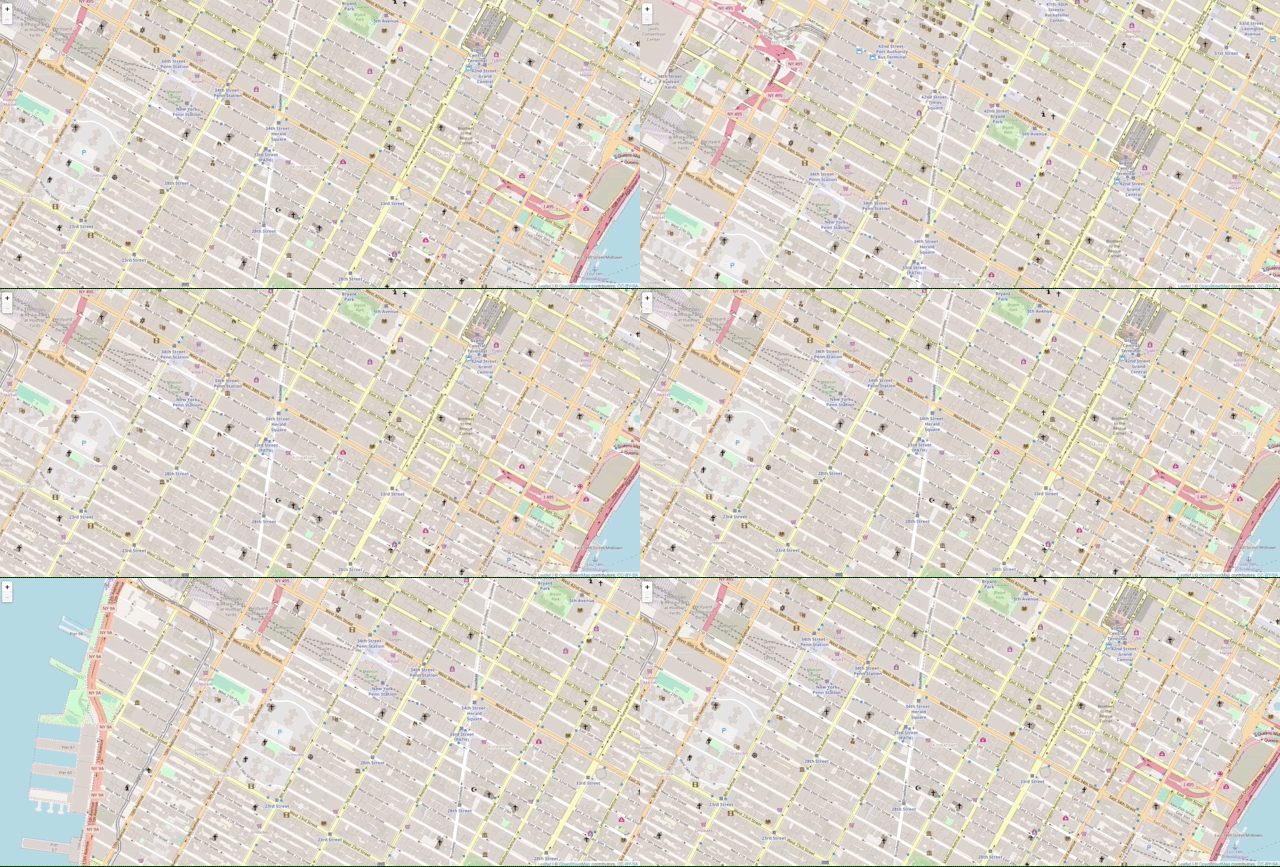
ตัวอย่างการใช้ setMaxBounds()

Interactive Maps with leaflet in R

มาฝึกกันเถอะ!

Interactive Maps with leaflet in R

Preparing Video For Download...