ธีม ggplot2 แบบกำหนดเอง

การสื่อสารด้วยข้อมูลใน Tidyverse

Timo Grossenbacher

Data Journalist

ข้อดีของการกำหนดรูปแบบเอง
การสื่อสารด้วยข้อมูลใน Tidyverse

ฟังก์ชัน theme()

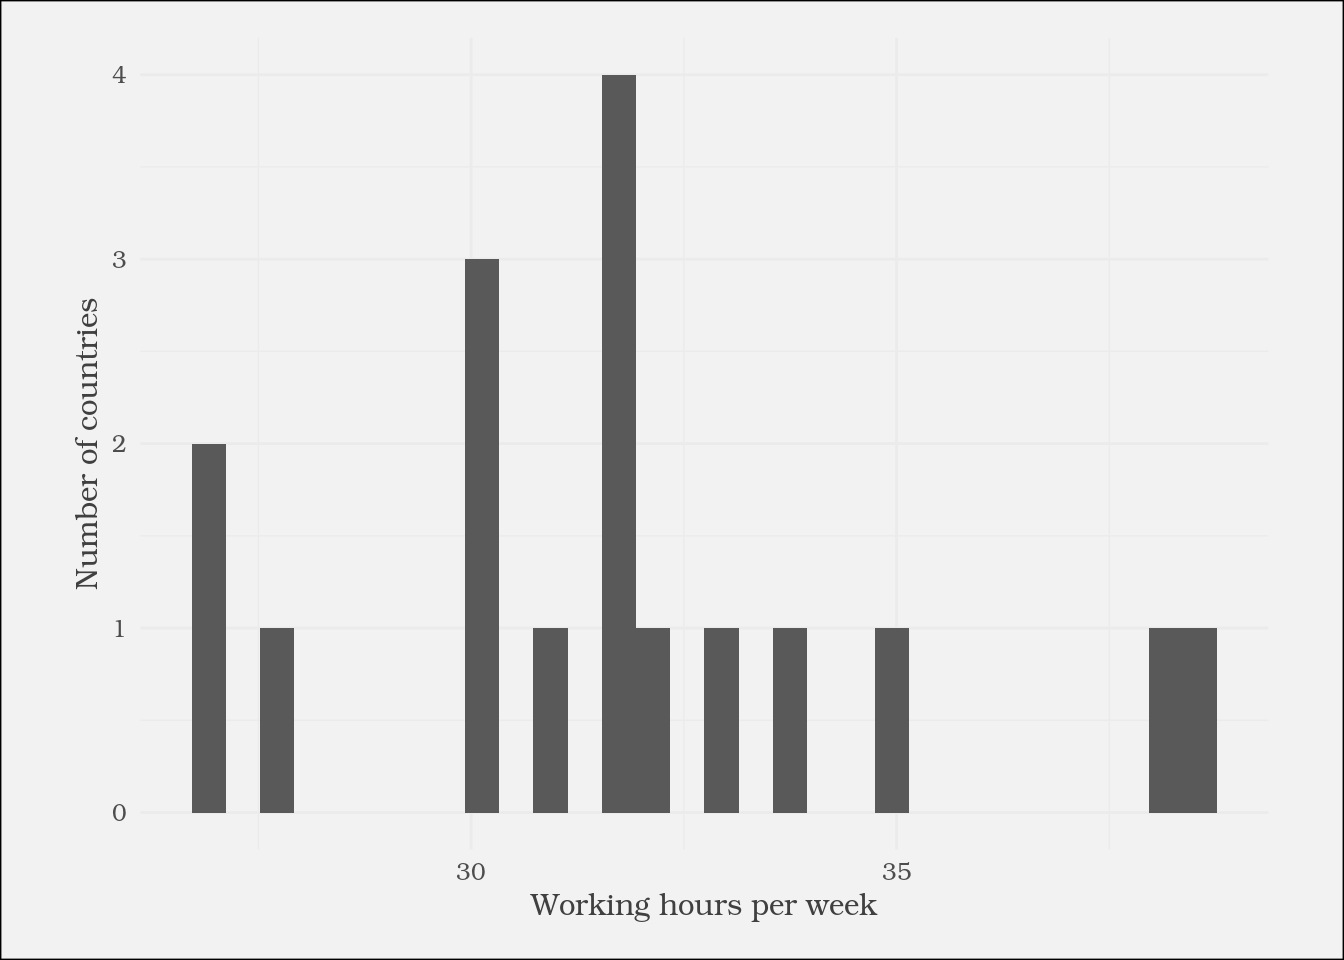
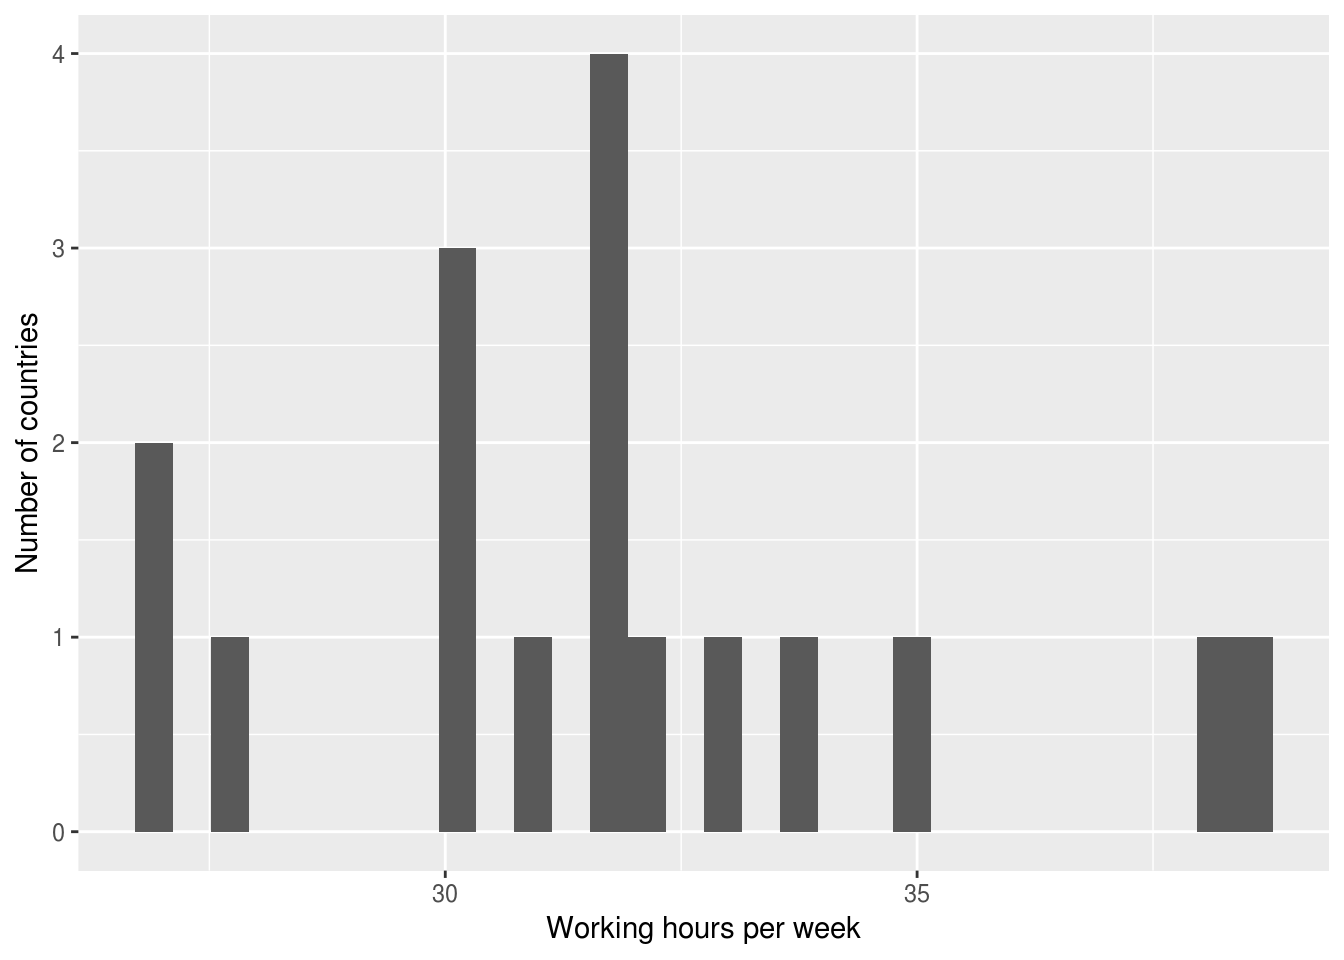
ggplot(plot_data) +
  geom_histogram(aes(
    x = working_hours)) +
  labs(x = "Working hours per week",
       y = "Number of countries") +
  theme(
    text = element_text(
      family = "Bookman",
      color = "gray25")
  )

การสื่อสารด้วยข้อมูลใน Tidyverse

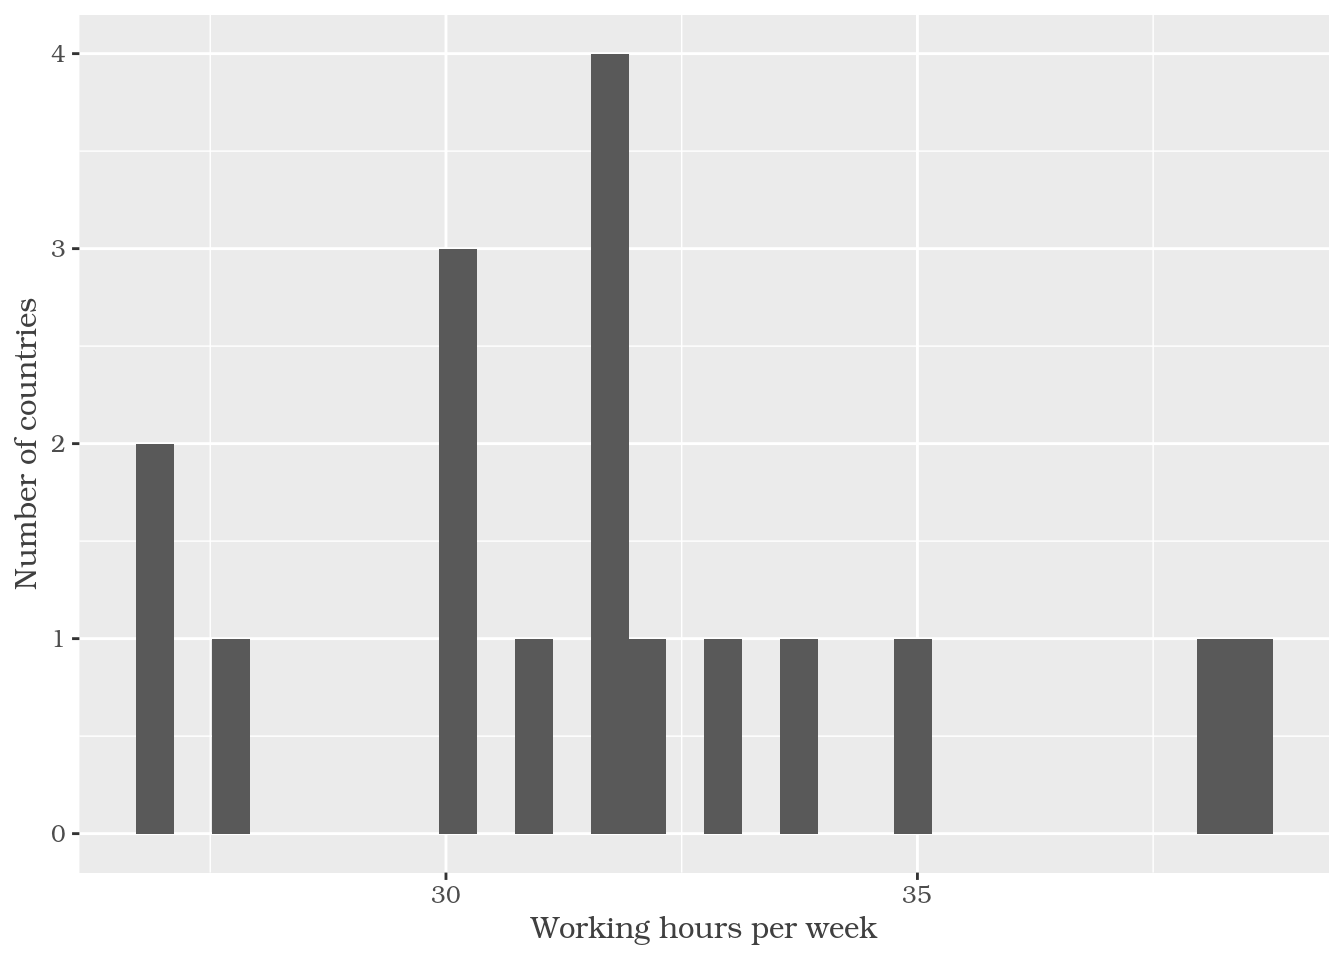
ธีมเริ่มต้นของ ggplot2

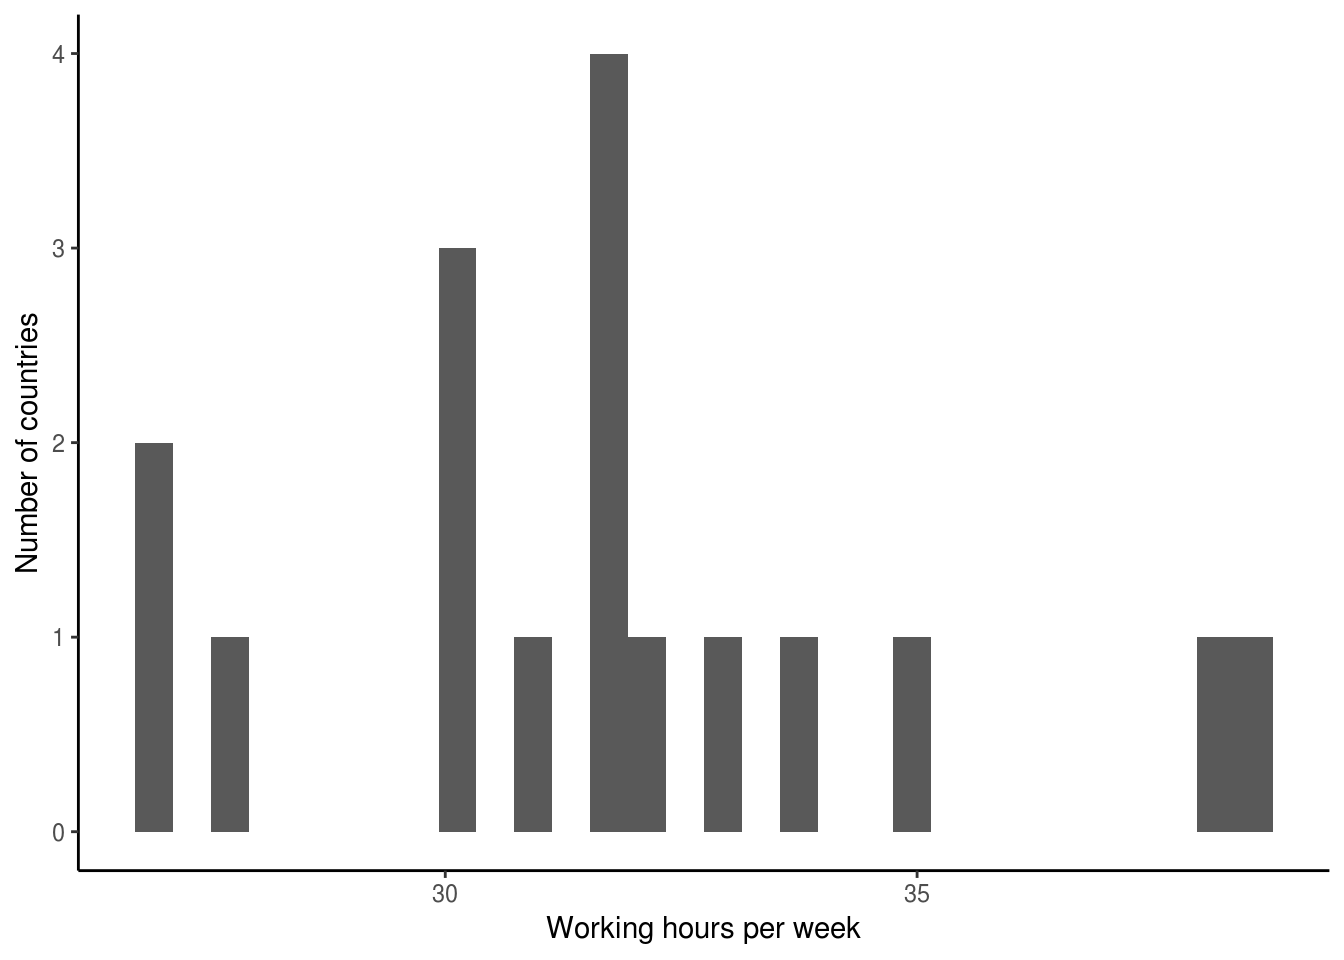
ggplot(plot_data) +
  geom_histogram(aes(
    x = working_hours)) +
  labs(x = "Working hours per week",
       y = "Number of countries") +

  theme_classic()

การสื่อสารด้วยข้อมูลใน Tidyverse

การเชื่อมต่อการเรียก theme()

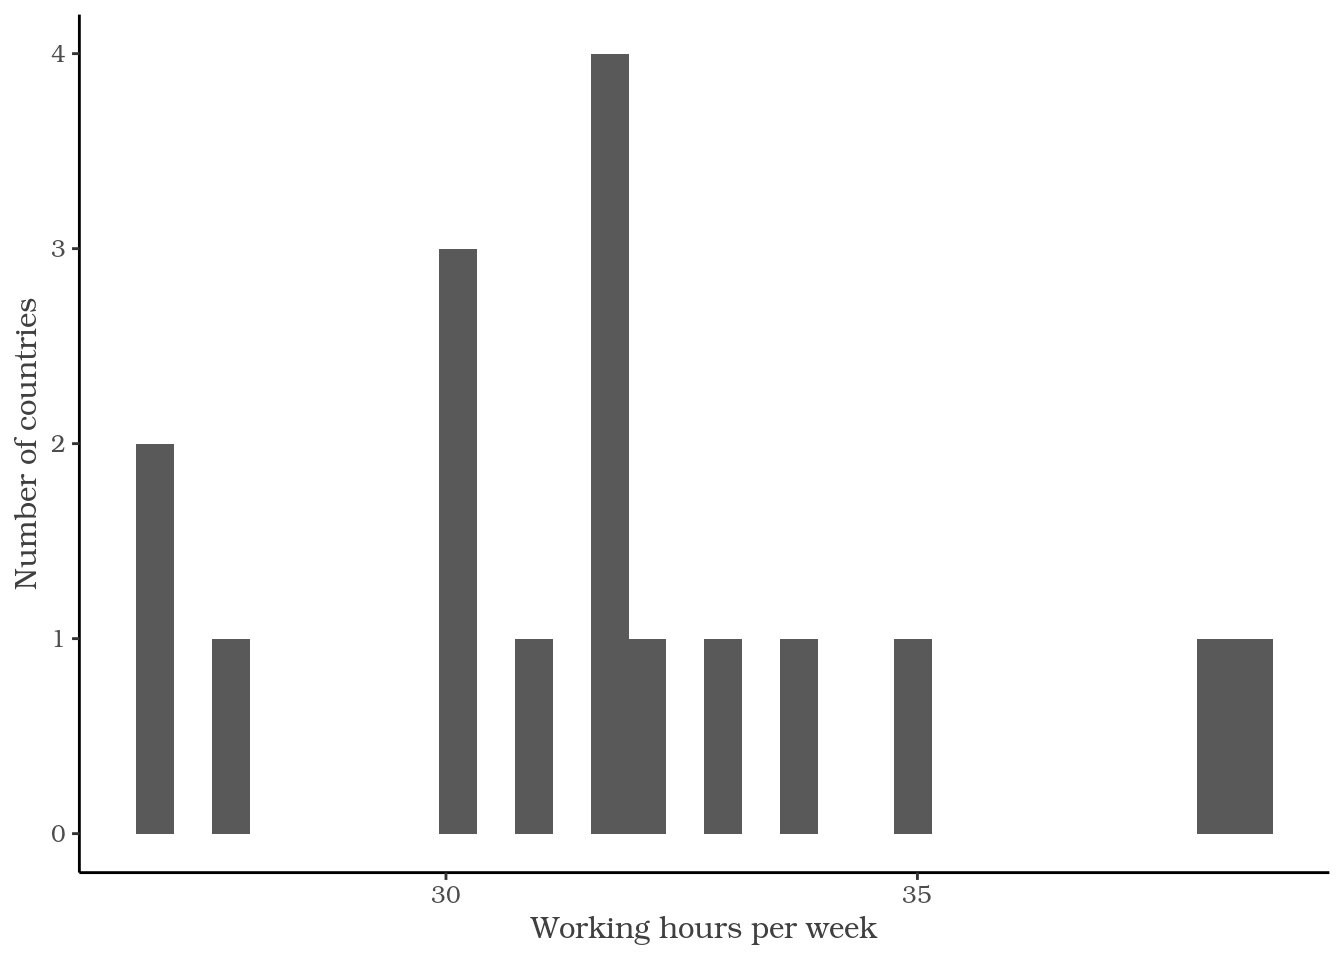
ggplot(plot_data) +
  geom_histogram(aes(
    x = working_hours)) +
  labs(x = "Working hours per week",
       y = "Number of countries") +

  theme_classic() +
  theme(
    text = element_text(
      family = "Bookman",
      color = "gray25")
  )

การสื่อสารด้วยข้อมูลใน Tidyverse

ตัวเลือกการตั้งค่าธีม

?theme

axis.title
ป้ายกำกับแกน (element_text; สืบทอดจาก text)

axis.title.x
ป้ายกำกับแกน x (element_text; สืบทอดจาก axis.title)

axis.title.x.top
ป้ายกำกับแกน x ด้านบน (element_text; สืบทอดจาก axis.title.x)

axis.title.x.bottom
ป้ายกำกับแกน x ด้านล่าง (element_text; สืบทอดจาก axis.title.x)

การสื่อสารด้วยข้อมูลใน Tidyverse

กลุ่มฟังก์ชัน element_*

element_text()
element_rect()
element_line()
element_blank()
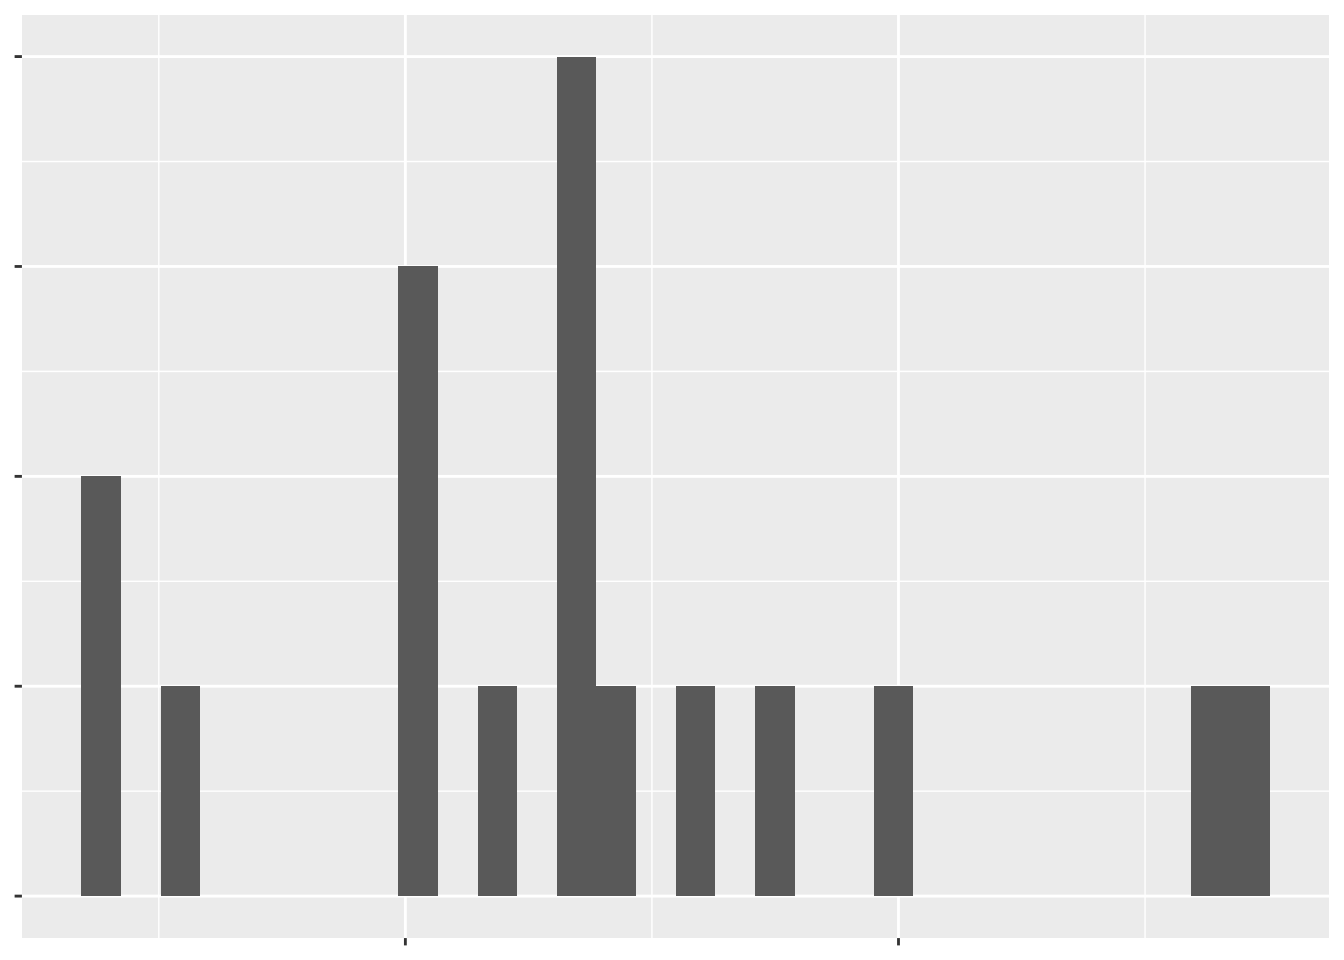
ggplot(plot_data) +
  geom_histogram(aes(
    x = working_hours)) +
  labs(x = "Working hours per week",
       y = "Number of countries") +
  theme(
    text = element_blank()
  )

การสื่อสารด้วยข้อมูลใน Tidyverse

มาลองใช้ธีมกันเถอะ!

การสื่อสารด้วยข้อมูลใน Tidyverse

Preparing Video For Download...