การปรับแต่ง dot plot

การสื่อสารด้วยข้อมูลใน Tidyverse

Timo Grossenbacher

Data Journalist
การสื่อสารด้วยข้อมูลใน Tidyverse

Factor levels

  • ลำดับของ ระดับ (levels) ของ factor จะกำหนดลำดับการแสดงผลใน ggplot2
ilo_data$country
Austria        Belgium        Czech Rep.     Finland       
France         Germany        Hungary    ...
 ...
 17 Levels: Austria Belgium Czech Rep. Finland France ... United Kingdom
การสื่อสารด้วยข้อมูลใน Tidyverse

การจัดเรียง factor ด้วยแพ็กเกจ forcats

  • โหลดด้วย library(forcats)
  • fct_drop — ลบ levels ที่ไม่ใช้
  • fct_rev — กลับลำดับ factor levels
  • fct_reorder — จัดเรียง factor levels ใหม่

1 เรียนรู้เพิ่มเติมได้ที่ tidyverse.org (http://forcats.tidyverse.org/)

การสื่อสารด้วยข้อมูลใน Tidyverse

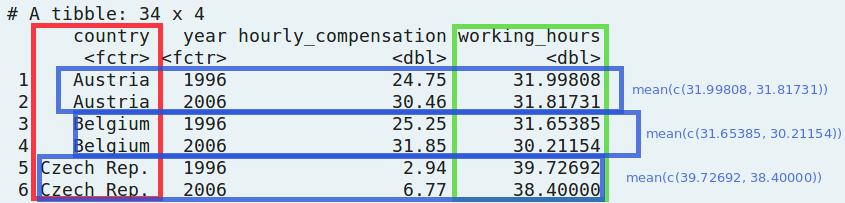
ฟังก์ชัน fct_reorder

ilo_data
# A tibble: 34 x 4
      country   year hourly_compensation working_hours
        <fct>  <fct>               <dbl>         <dbl>
 1    Austria   1996               24.75      31.99808
 2    Austria   2006               30.46      31.81731
 3    Belgium   1996               25.25      31.65385
 4    Belgium   2006               31.85      30.21154
ilo_data <- ilo_data  %>% 
    mutate(country = fct_reorder(country, working_hours, mean))
ilo_data$country
17 Levels: Netherlands Norway Germany Sweden ... Czech Rep.
การสื่อสารด้วยข้อมูลใน Tidyverse

การสื่อสารด้วยข้อมูลใน Tidyverse

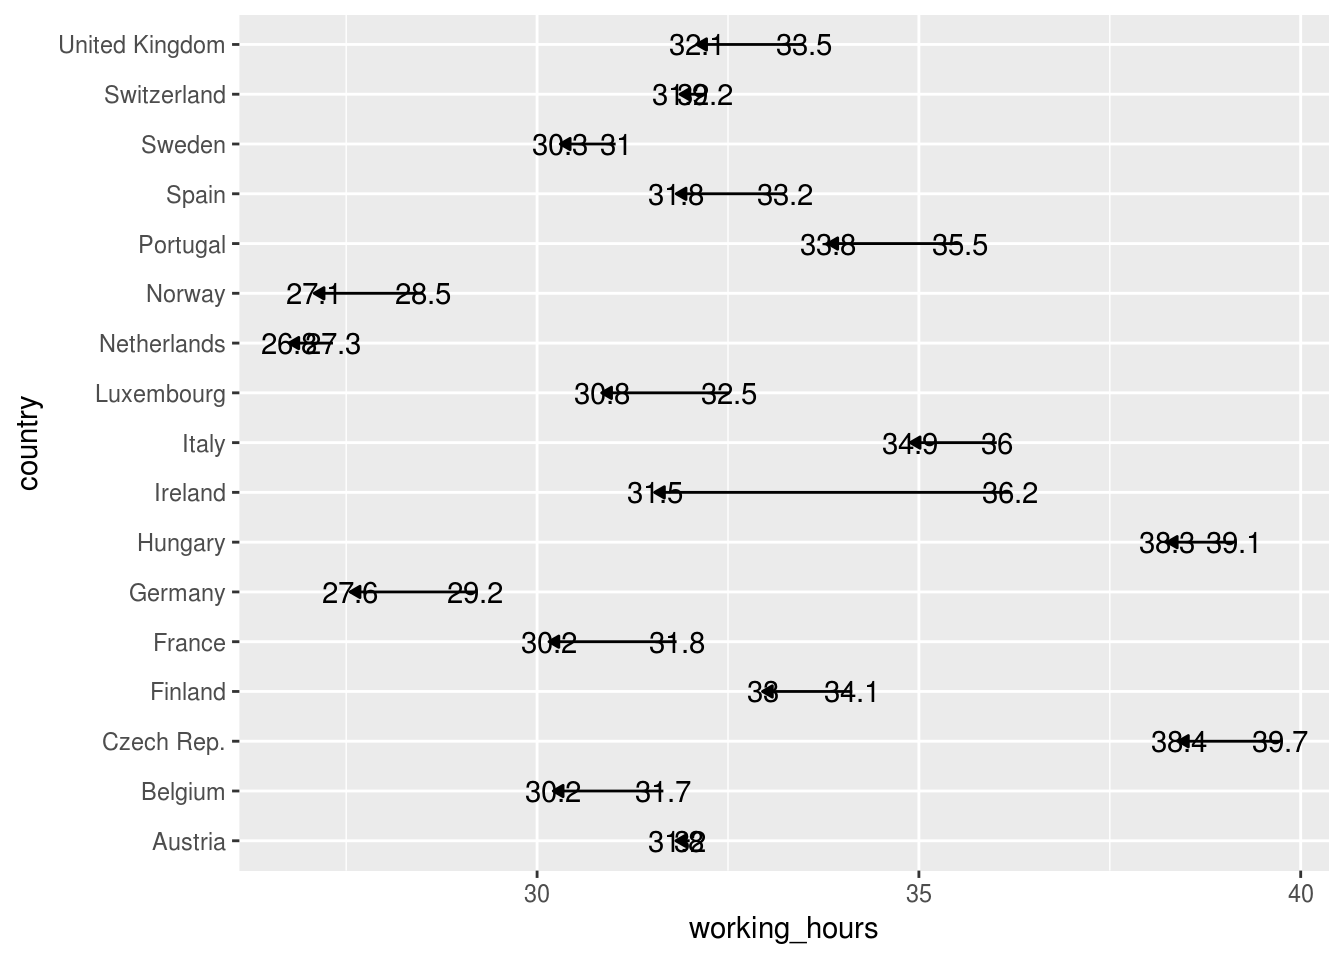
การขยับ label ด้วย hjust และ vjust

ggplot(ilo_data) +
  geom_path(aes(...)) +
  geom_text(
        aes(...,
            hjust = ifelse(year == "2006", 
              1.4, 
              -0.4)
        )
    )
การสื่อสารด้วยข้อมูลใน Tidyverse

มาฝึกกันเถอะ!

การสื่อสารด้วยข้อมูลใน Tidyverse

Preparing Video For Download...