R สำหรับผู้ใช้ SAS
Melinda Higgins, PhD
Research Professor/Senior Biostatistician Emory University

ggplot2 เป็นแพ็กเกจกราฟิกที่ทรงพลังสำหรับ Rggplot ย่อมาจาก "grammar of graphics"ggplot2 ใช้แนวทางแบบเลเยอร์ในการสร้างกราฟิก# Create plot for x=sex and y=diameter
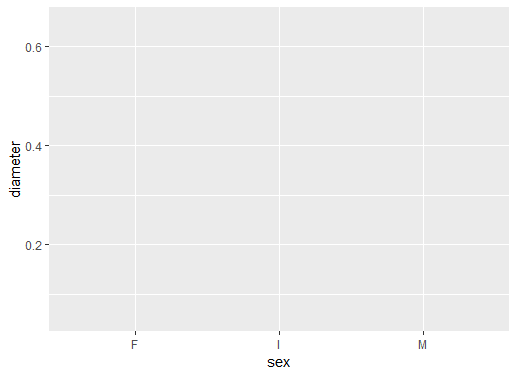
ggplot(data = abalone, aes(sex, diameter))
ggplot()data = abaloneกำหนด aes เป็น sex และ diameter
ยังไม่มีออบเจกต์กราฟิกในพล็อต
sexdiameter
# Add boxplot geometric object or geom
ggplot(data = abalone,
aes(sex, diameter)) +
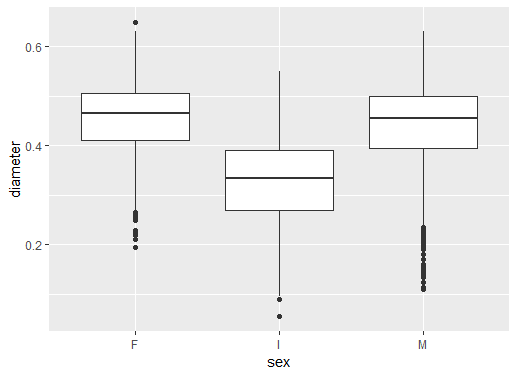
geom_boxplot()
+ ใช้เพิ่มเลเยอร์เพิ่ม boxplot ด้วย geom_boxplot()
ผลลัพธ์คือชุดของ boxplot
F คือเพศเมีย I คือตัวอ่อน และ M คือเพศผู้
# Add black white theme
ggplot(data = abalone,
aes(sex, diameter)) +
geom_boxplot() +
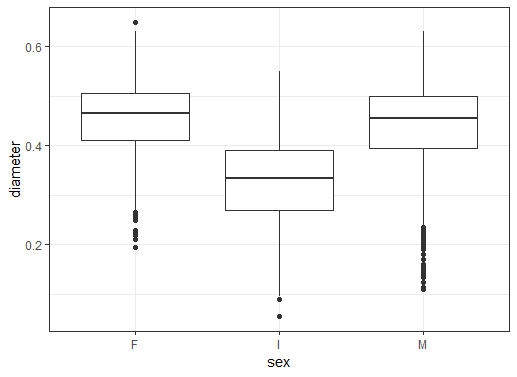
theme_bw()
theme_bw()
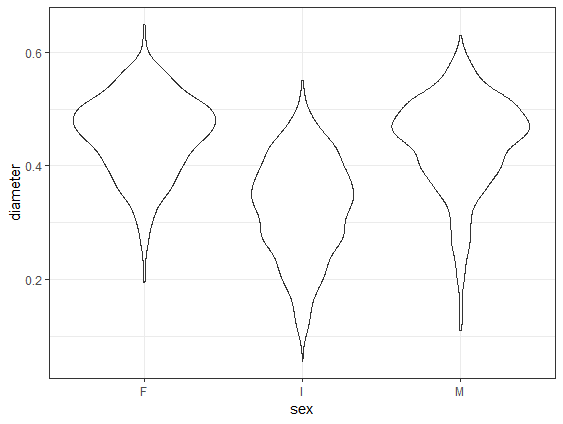
# Change to geom_violin()
ggplot(data = abalone,
aes(sex, diameter)) +
geom_violin() +
theme_bw()
geom_violin แทนที่ geom_boxplot
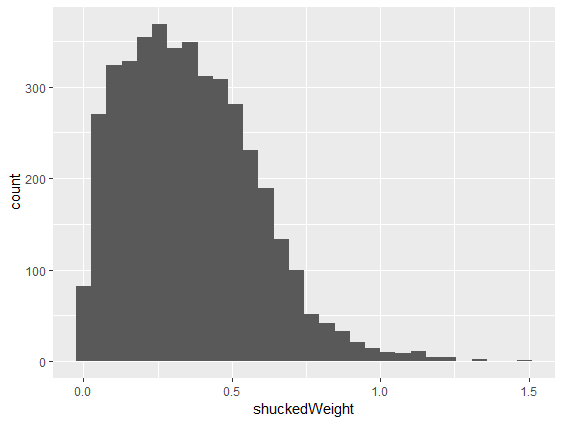
# Make histogram of shuckedWeight
ggplot(abalone, aes(shuckedWeight)) +
geom_histogram()
geom_histogram()aes() เป็น shuckedWeight
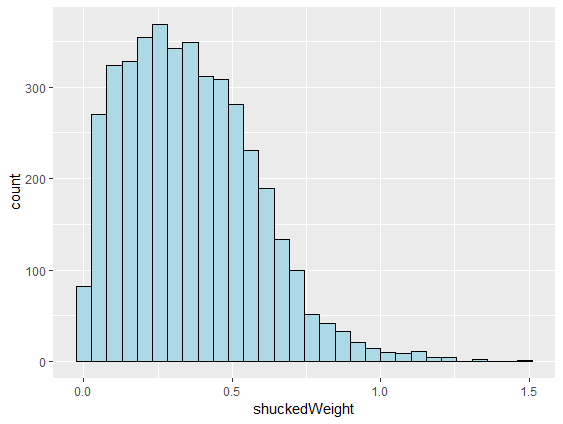
# Make lines black and fill light blue
ggplot(abalone, aes(shuckedWeight)) +
geom_histogram(color = "black",
fill = "lightblue")
color ของเส้นขอบแท่งfill ของแท่ง()
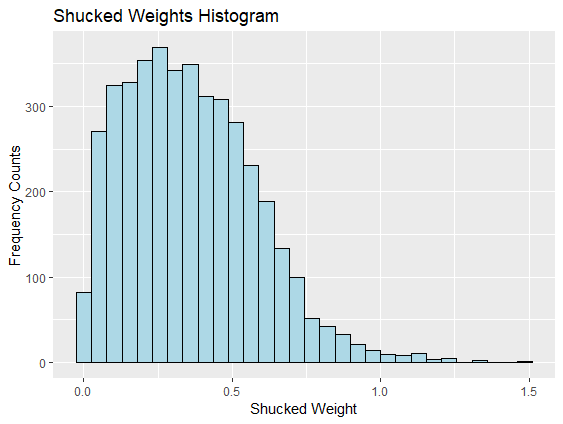
# Add x, y axis labels and title
ggplot(abalone, aes(shuckedWeight)) +
geom_histogram(color = "black",
fill = "lightblue") +
xlab("Shucked Weight") +
ylab("Frequency Counts") +
ggtitle("Shucked Weights Histogram")
xlab() และ ylab() สำหรับแกนggtitle() สำหรับชื่อเรื่อง
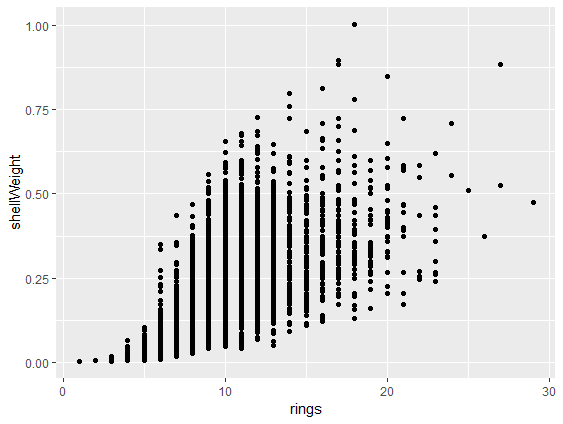
# Make scatterplot with geom_point()
ggplot(abalone,
aes(rings, shellWeight)) +
geom_point()
aes สองตัวแปรgeom_point() ใช้เพิ่มจุดข้อมูล
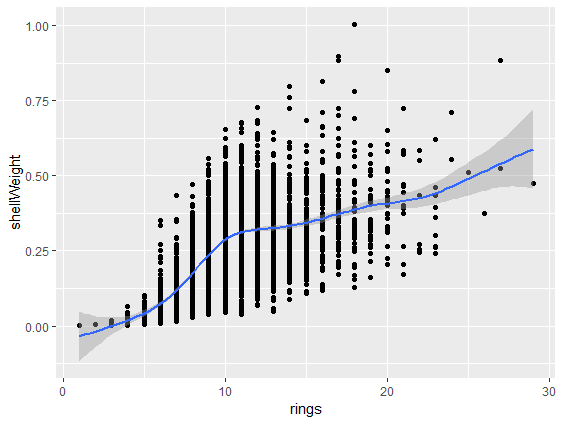
# Add smoothed fit line
ggplot(abalone,
aes(rings, shellWeight)) +
geom_point() +
geom_smooth()
geom_smooth() ลงใน scatterplot
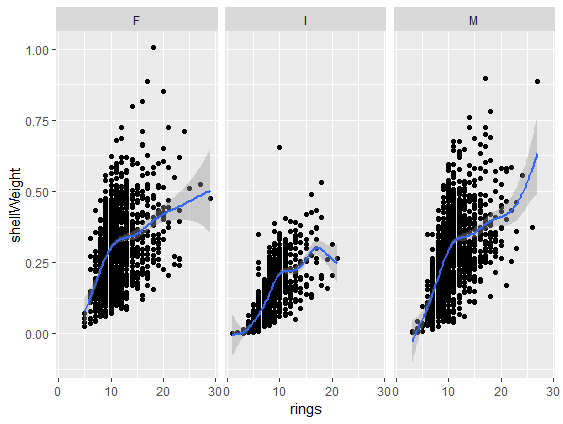
# Add panels using facet_wrap()
ggplot(abalone,
aes(rings, shellWeight)) +
geom_point() +
geom_smooth() +
facet_wrap(vars(sex))
facet_wrap()vars(sex) กำหนดตัวแปรสำหรับแผงย่อย
ggplot2R สำหรับผู้ใช้ SAS