ความพอดีของโมเดล

Introduction to Linear Modeling in Python

Jason Vestuto

Data Scientist

R สามตัว

การสร้างโมเดล:

  • RSS

การประเมินโมเดล:

  • RMSE
  • R-squared
Introduction to Linear Modeling in Python

RMSE

residuals = y_model - y_data
RSS = np.sum( np.square(residuals) )
mean_squared_residuals = np.sum( np.square(residuals) ) / len(residuals)
MSE = np.mean( np.square(residuals) )
RMSE = np.sqrt(np.mean( np.square(residuals)))
RMSE = np.std(residuals)
Introduction to Linear Modeling in Python

R-Squared ในโค้ด

ค่าเบี่ยงเบน:

deviations = np.mean(y_data) - y_data
VAR = np.sum(np.square(deviations))

ค่าคงเหลือ:

residuals = y_model - y_data
RSS = np.sum(np.square(residuals))

R-squared:

r_squared = 1 - (RSS / VAR)
r = correlation(y_data, y_model)
Introduction to Linear Modeling in Python

R-Squared ในข้อมูลจริง

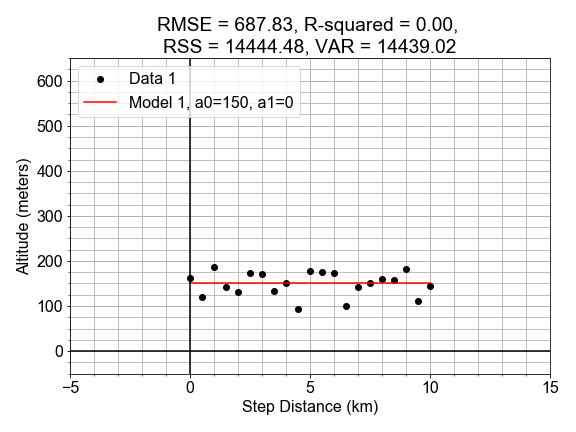
กราฟกระจายของระดับความสูงเทียบกับระยะทาง พร้อมเส้นโมเดลสีแดงที่ลากผ่านจุดข้อมูล ทั้งเส้นและข้อมูลอยู่ในแนวระนาบโดยมีความชันเป็นศูนย์

Introduction to Linear Modeling in Python

R-Squared ในข้อมูลจริง

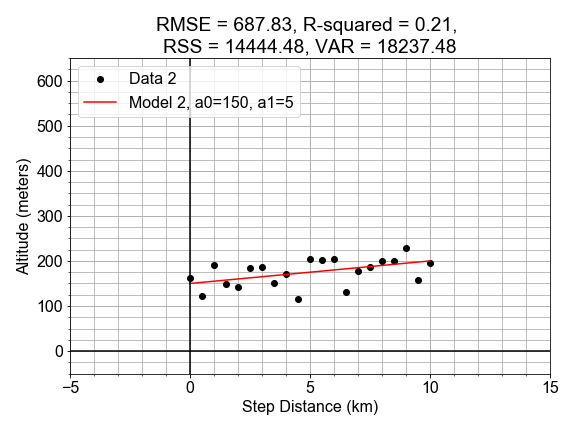
กราฟกระจายของระดับความสูงเทียบกับระยะทาง พร้อมเส้นโมเดลสีแดงที่ลากผ่านจุดข้อมูล ทั้งเส้นและข้อมูลมีความชันเล็กน้อย

Introduction to Linear Modeling in Python

R-Squared ในข้อมูลจริง

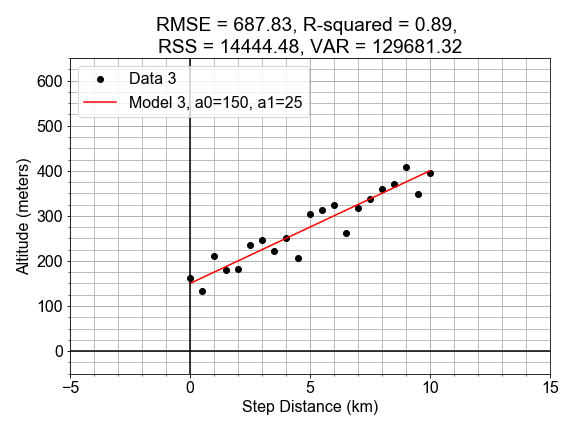
กราฟกระจายของระดับความสูงเทียบกับระยะทาง พร้อมเส้นโมเดลสีแดงที่ลากผ่านจุดข้อมูล ทั้งเส้นและข้อมูลมีความชันปานกลาง มองเห็นเป็นเนินลาดเอียงพอสมควร

Introduction to Linear Modeling in Python

R-Squared ในข้อมูลจริง

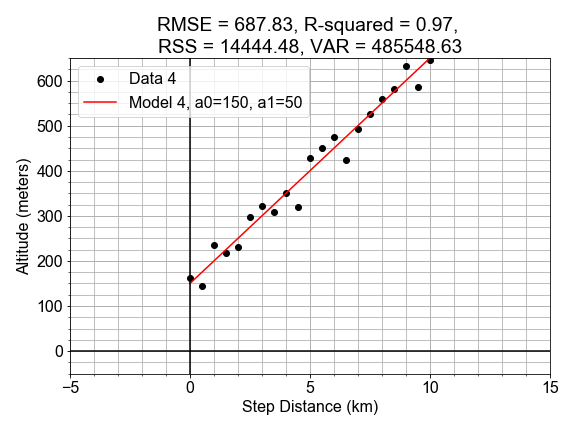
กราฟกระจายของระดับความสูงเทียบกับระยะทาง พร้อมเส้นโมเดลสีแดงที่ลากผ่านจุดข้อมูล ทั้งเส้นและข้อมูลมีความชันสูง มองเห็นเป็นเนินชันมาก

Introduction to Linear Modeling in Python

RMSE vs R-Squared

  • RMSE: วัดปริมาณความแปรปรวนที่เป็นค่าคงเหลือ
  • R-squared: วัดสัดส่วนความแปรปรวนที่อธิบายได้ด้วยความสัมพันธ์เชิงเส้น
Introduction to Linear Modeling in Python

มาฝึกกันเถอะ!

Introduction to Linear Modeling in Python

Preparing Video For Download...