การปรับแต่งโมเดล

Introduction to Linear Modeling in Python

Jason Vestuto

Data Scientist

Residuals

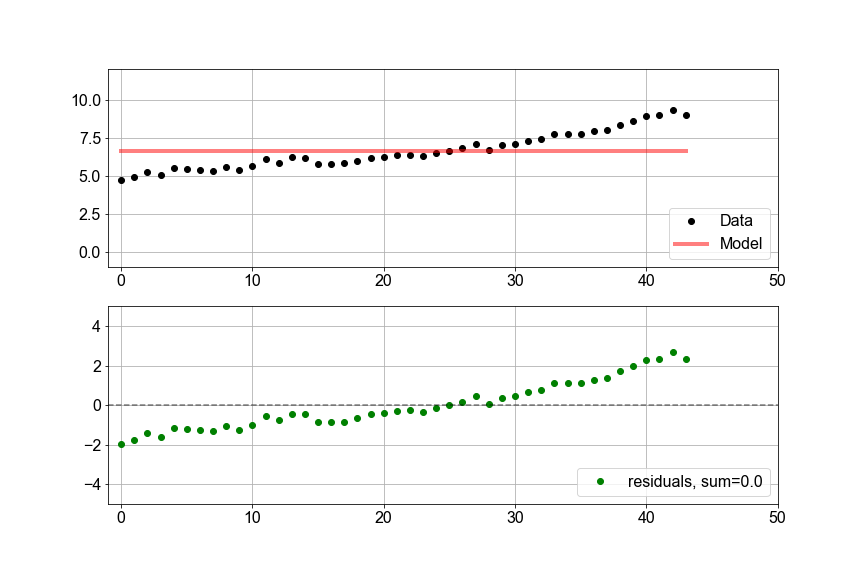
กราฟ 2 พาเนล พาเนลบนแสดง scatter plot ของระดับน้ำทะเลเทียบกับเวลาและเส้นโมเดล พาเนลล่างแสดง residuals ซึ่งคือความต่างระหว่างข้อมูลกับโมเดลในพาเนลบน


residuals = y_model - y_data
len(residuals) == len(y_data)
True
Introduction to Linear Modeling in Python

ผลรวมของ Residuals

กราฟ 2 พาเนล พาเนลบนแสดง scatter plot ของระดับน้ำทะเลเทียบกับเวลาและเส้นโมเดล พาเนลล่างแสดง residuals ซึ่งคือความต่างระหว่างข้อมูลกับโมเดลในพาเนลบน


residuals = y_model - y_data
print(np.sum(residuals))
0.0
Introduction to Linear Modeling in Python

Residuals ยกกำลังสอง

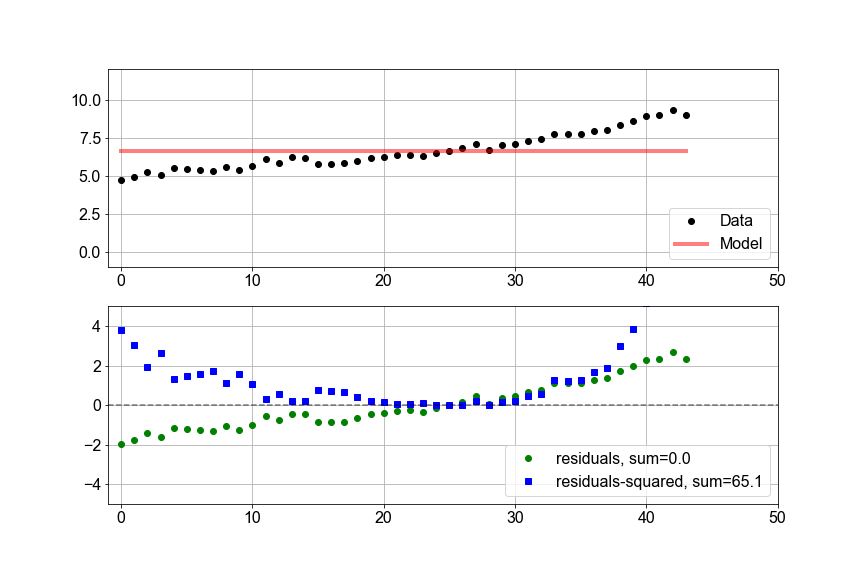
กราฟ 2 พาเนล พาเนลบนแสดง scatter plot ของระดับน้ำทะเลเทียบกับเวลาและเส้นโมเดลที่ไม่ดี (ค่าคงที่) พาเนลล่างแสดง residuals เป็นจุดสีเขียวและ residuals ยกกำลังสองเป็นสี่เหลี่ยมสีน้ำเงิน

residuals_squared = np.square(y_model - y_data)
print(np.sum(residuals_squared))
65.1
Introduction to Linear Modeling in Python

RSS

กราฟ 2 พาเนล พาเนลบนแสดง scatter plot ของระดับน้ำทะเลเทียบกับเวลาและเส้นโมเดลที่ไม่ดี (ค่าคงที่) พาเนลล่างแสดง residuals เป็นจุดสีเขียวและ residuals ยกกำลังสองเป็นสี่เหลี่ยมสีน้ำเงิน


resid_squared = np.square(y_model - y_data)
RSS = np.sum(resid_squared)
Introduction to Linear Modeling in Python

RSS

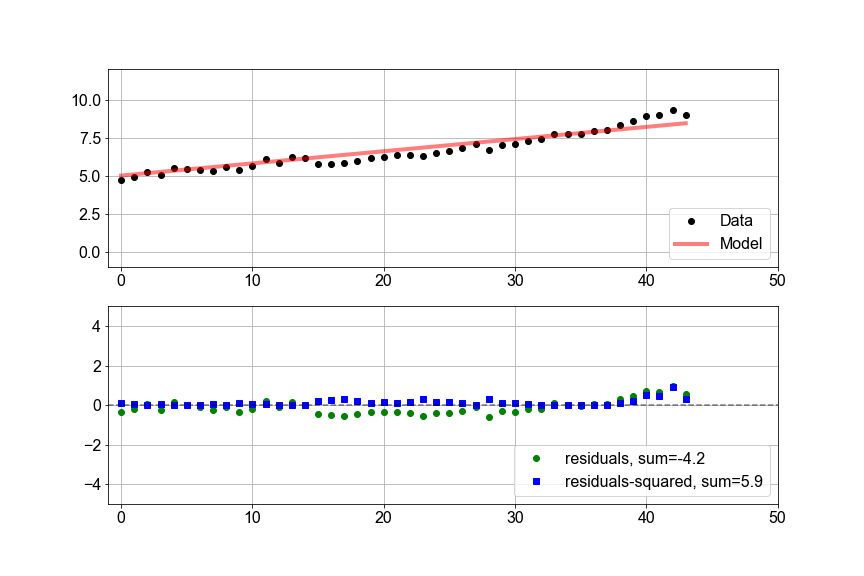
กราฟ 2 พาเนล พาเนลบนแสดง scatter plot ของระดับน้ำทะเลเทียบกับเวลาและเส้นโมเดลที่ดีขึ้น พาเนลล่างแสดง residuals เป็นจุดสีเขียวและ residuals ยกกำลังสองเป็นสี่เหลี่ยมสีน้ำเงิน แสดงให้เห็นว่าโมเดลพอดีกับข้อมูลมากขึ้น


RSS = np.sum(np.square(y_model - y_data))
print(RSS)
5.9
Introduction to Linear Modeling in Python

การเปลี่ยนแปลงของ RSS

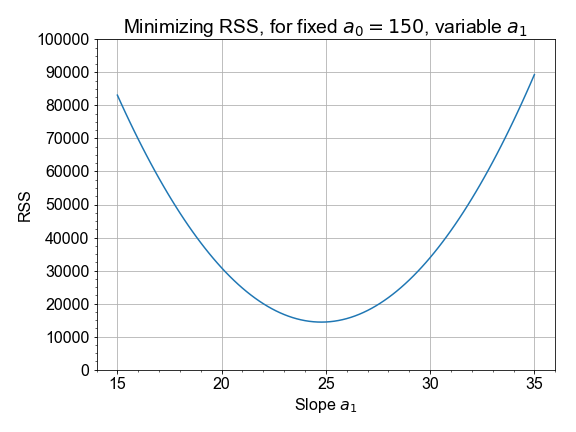
กราฟแสดงค่า RSS บนแกน y เทียบกับค่า slope บนแกน x มีรูปร่างเป็นพาราโบลาหงาย โดยมีค่าต่ำสุดใกล้ slope=25

  • ค่า RSS ที่ต่ำสุดให้ residuals น้อยที่สุด
  • Residuals น้อยที่สุดหมายถึงโมเดลที่ดีที่สุด
Introduction to Linear Modeling in Python

มาฝึกกันเถอะ!

Introduction to Linear Modeling in Python

Preparing Video For Download...