การวัดความสัมพันธ์เชิงเส้น

Introduction to Linear Modeling in Python

Jason Vestuto

Data Scientist

การแสดงผลเบื้องต้น
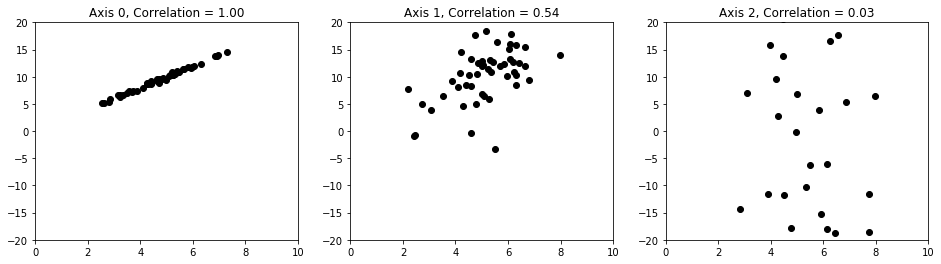
ภาพ 3 แผง แสดง scatter plot 3 กราฟ จากความสัมพันธ์สูงไปศูนย์ จากซ้ายไปขวา

Introduction to Linear Modeling in Python

ทบทวนสถิติตัวแปรเดียว

# Mean
mean = sum(x)/len(x)
# Deviation, sometimes called "centering"
dx = x - np.mean(x)
# Variance
variance = np.mean(dx*dx)
# Standard Deviation
stdev = np.sqrt(variance)
Introduction to Linear Modeling in Python

ความแปรปรวนร่วม

# Deviations of two variables
dx = x - np.mean(x)
dy = y - np.mean(y)
# Co-vary means to vary together
deviation_products = dx*dy
# Covariance as the mean
covariance = np.mean(dx*dy)
Introduction to Linear Modeling in Python

สหสัมพันธ์

# Divide deviations by standard deviation 
zx = dx/np.std(x)
zy = dy/np.std(y)
# Mean of the normalize deviations
correlation = np.mean(zx*zy)
Introduction to Linear Modeling in Python

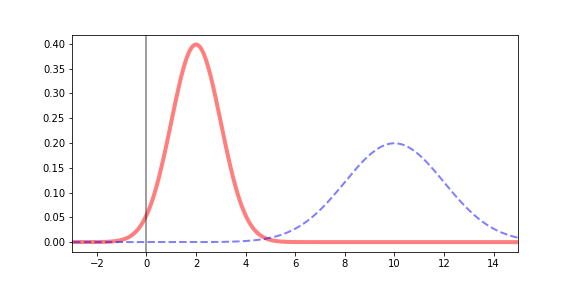
การทำให้เป็นมาตรฐาน: ก่อน

กราฟการแจกแจงแบบเกาส์เซียน รูปทรงระฆัง มีศูนย์กลาง ความสูง และความกว้างต่างกัน

Introduction to Linear Modeling in Python

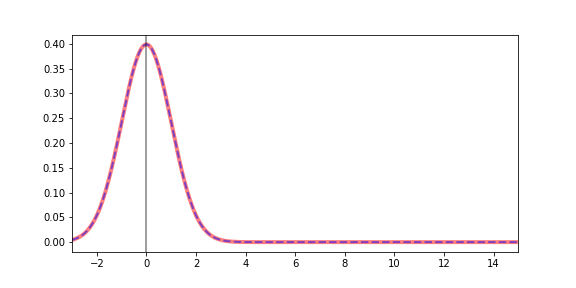
การทำให้เป็นมาตรฐาน: หลัง

กราฟการแจกแจงแบบเกาส์เซียน รูปทรงระฆัง ทั้งคู่มีศูนย์กลางที่ศูนย์ ความสูงและความกว้างเท่ากัน

Introduction to Linear Modeling in Python

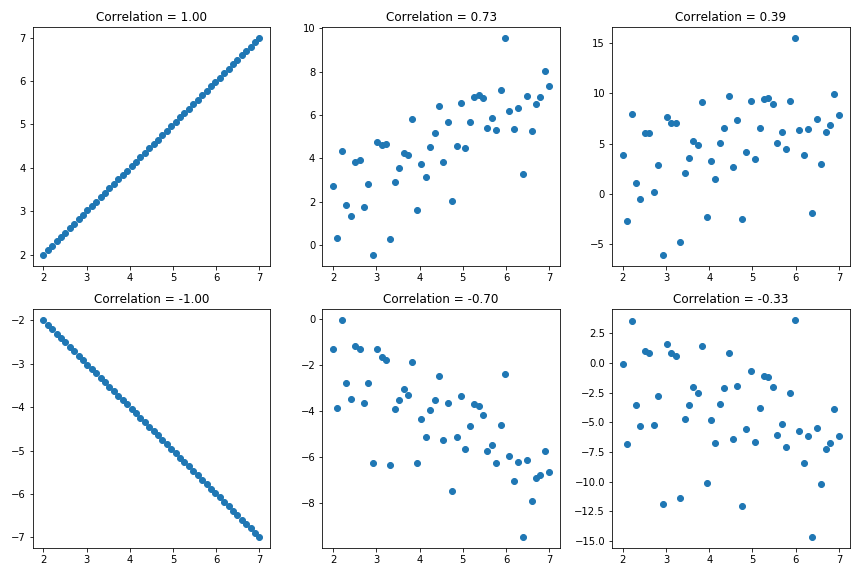
ขนาดและทิศทาง

  • ค่าสหสัมพันธ์: -1 ถึง +1

ภาพ 6 แผง 2 แถว 3 คอลัมน์ แสดง scatter plot ความสัมพันธ์แข็งแกร่งถึงอ่อนจากซ้ายไปขวา

  • สองส่วน: ขนาด (1 ถึง 0) และทิศทาง (+ หรือ -)
Introduction to Linear Modeling in Python

มาฝึกกันเถอะ!

Introduction to Linear Modeling in Python

Preparing Video For Download...