ข้อผิดพลาดของโมเดลและความสุ่ม

Introduction to Linear Modeling in Python

Jason Vestuto

Data Scientist

ประเภทของข้อผิดพลาด

  1. ข้อผิดพลาดในการวัด
    • เช่น: เซ็นเซอร์เสีย, บันทึกค่าผิดพลาด
  2. อคติในการสุ่มตัวอย่าง
    • เช่น: วัดอุณหภูมิเฉพาะในเดือนสิงหาคมซึ่งร้อนที่สุด
  3. ความบังเอิญจากความสุ่ม
Introduction to Linear Modeling in Python

Null Hypothesis

คำถาม: ผลที่เกิดขึ้นมาจากความสัมพันธ์หรือความสุ่ม?

คำตอบ: ตรวจสอบด้วย Null Hypothesis

Introduction to Linear Modeling in Python

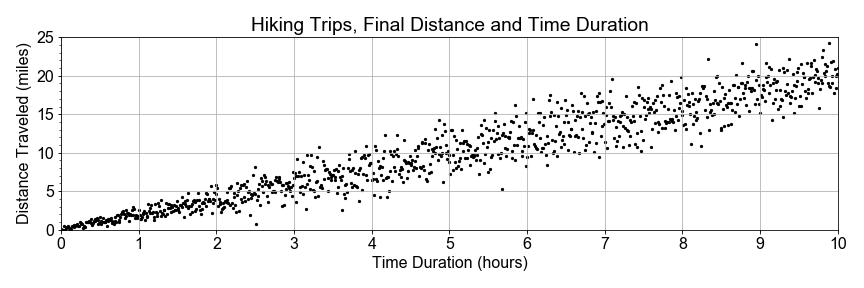
ข้อมูลที่เรียงลำดับ

กราฟกระจายของข้อมูลการเดินป่า แสดงแกน x เป็นระยะทาง (ไมล์) และแกน y เป็นระยะเวลา (ชั่วโมง)

Introduction to Linear Modeling in Python

การจัดกลุ่มข้อมูล

กราฟกระจายของข้อมูลการเดินป่า แสดงแกน x เป็นระยะทาง (ไมล์) และแกน y เป็นระยะเวลา (ชั่วโมง) โดยจุดที่ใช้เวลาน้อยกว่า 5 ชั่วโมงแสดงด้วยสีแดง และจุดที่มากกว่าแสดงด้วยสีน้ำเงิน

Introduction to Linear Modeling in Python

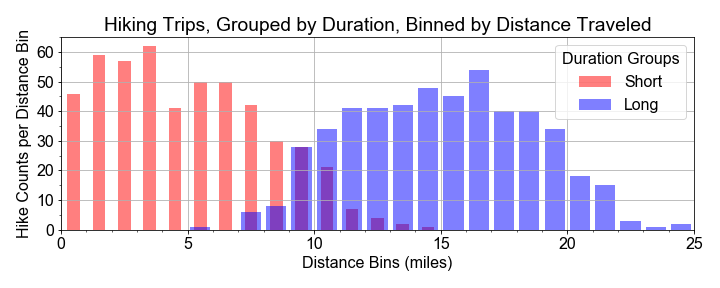
การจัดกลุ่มข้อมูล

ฮิสโทแกรม 2 อัน รูปร่างคล้ายระฆัง อันสีแดงสำหรับทริประยะสั้นมีค่ากลางประมาณ 5 ไมล์ อันสีน้ำเงินสำหรับทริประยะยาวมีค่ากลางประมาณ 15 ไมล์

  • กลุ่มระยะเวลาสั้น, mean = 5
  • กลุ่มระยะเวลายาว, mean = 15
Introduction to Linear Modeling in Python

Test Statistic

# Group into early and late times
group_short = sample_distances[times < 5]
group_long = sample_distances[times > 5]
# Resample distributions
resample_short = np.random.choice(group_short, size=500, replace=True)
resample_long = np.random.choice(group_long, size=500, replace=True)
# Test Statistic
test_statistic = resample_long - resample_short
# Effect size as mean of test statistic distribution
effect_size = np.mean(test_statistic)
Introduction to Linear Modeling in Python

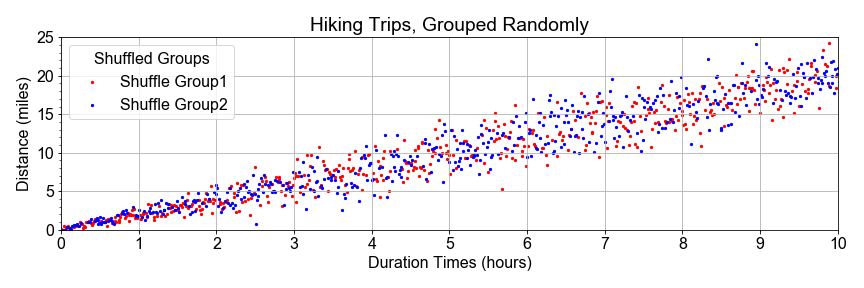
การสับเปลี่ยนและจัดกลุ่มใหม่

กราฟกระจายของข้อมูลการเดินป่า แสดงแกน x เป็นระยะทาง (ไมล์) และแกน y เป็นระยะเวลา (ชั่วโมง) โดยจุดสีแดงและสีน้ำเงินกระจายปะปนกันตลอดทุกช่วงเวลา

Introduction to Linear Modeling in Python

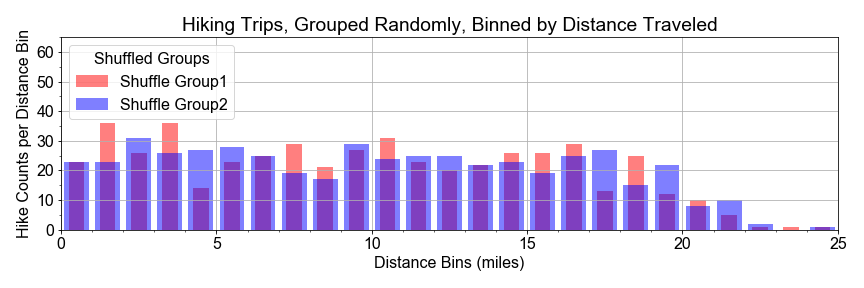
การสับเปลี่ยนและจัดกลุ่มใหม่

ฮิสโทแกรม 2 อันที่ทับซ้อนกันเกือบทั้งหมด กระจายตัวจาก 0 ถึง 25 ไมล์ มีรูปร่างใกล้เคียงกัน

Introduction to Linear Modeling in Python

การสับเปลี่ยนและแบ่งข้อมูล

# Concatenate and Shuffle
shuffle_bucket = np.concatenate((group_short, group_long))
np.random.shuffle(shuffle_bucket)
# Split in the middle
slice_index = len(shuffle_bucket)//2
shuffled_half1 = shuffle_bucket[0:slice_index]
shuffled_half2 = shuffle_bucket[slice_index+1:]
Introduction to Linear Modeling in Python

สุ่มตัวอย่างซ้ำและทดสอบอีกครั้ง

# Resample shuffled populations
shuffled_sample1 = np.random.choice(shuffled_half1, size=500, replace=True)
shuffled_sample2 = np.random.choice(shuffled_half2, size=500, replace=True)
# Recompute effect size
shuffled_test_statistic = shuffled_sample2 - shuffled_sample1
effect_size = np.mean(shuffled_test_statistic)
Introduction to Linear Modeling in Python

p-Value

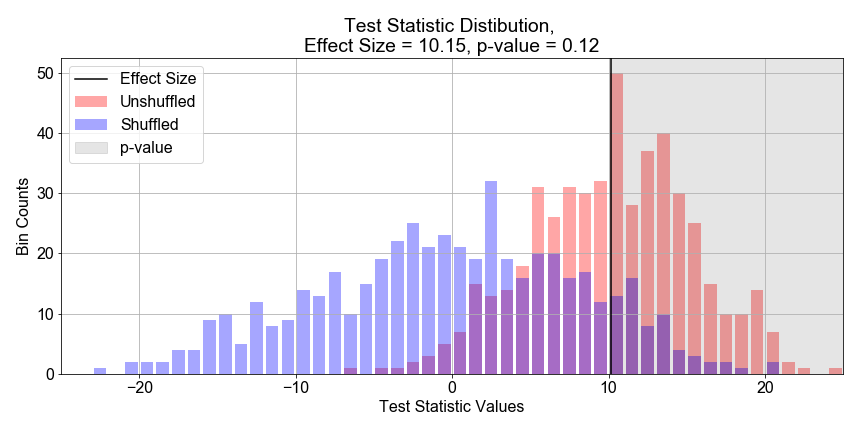
กราฟแสดงแกน x เป็นค่า test statistic และแกน y เป็นจำนวน ประกอบด้วยฮิสโทแกรม 2 อัน อันสีน้ำเงินมีค่ากลางที่ x=0 กระจายกว้าง อันสีแดงมีค่ากลางที่ x=10 กระจายแคบกว่า และมีเส้นแนวตั้งสีดำที่ x=10

Introduction to Linear Modeling in Python

มาฝึกกันเถอะ!

Introduction to Linear Modeling in Python

Preparing Video For Download...