แนวคิดสถิติเชิงอนุมาน

Introduction to Linear Modeling in Python

Jason Vestuto

Data Scientist

การแจกแจงความน่าจะเป็น
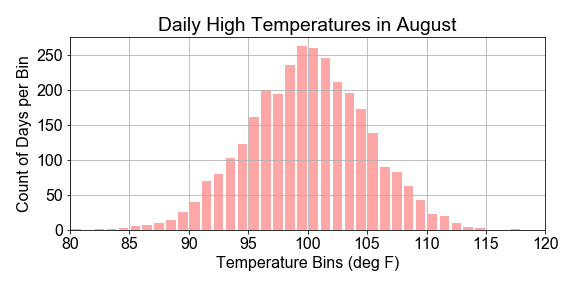
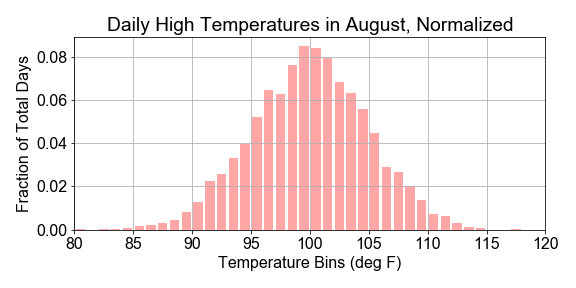
ฮิสโตแกรมแสดงจำนวนวันเทียบกับช่วงอุณหภูมิ อุณหภูมิสูงสุดในเดือนสิงหาคม

Introduction to Linear Modeling in Python

ประชากรและสถิติ

ฮิสโตแกรมแสดงจำนวนวันเทียบกับช่วงอุณหภูมิ อุณหภูมิสูงสุดในเดือนสิงหาคม

Introduction to Linear Modeling in Python

การสุ่มตัวอย่างจากประชากร

สถิติประชากรเทียบกับสถิติตัวอย่าง

print( len(month_of_temps), month_of_temps.mean(), month_of_temps.std() )
print( len(decade_of_temps), decade_of_temps.mean(), decade_of_temps.std() )

การสุ่มตัวอย่างจากประชากร

month_of_temps = np.random.choice(decade_of_temps, size=31)
Introduction to Linear Modeling in Python

การแสดงผลการแจกแจง

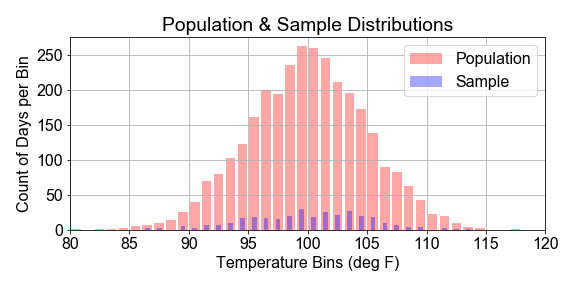
ฮิสโตแกรม 2 ภาพ แบ่งเป็นตัวอย่างและประชากร แสดงจำนวนวันเทียบกับช่วงอุณหภูมิ โดยแท่งของตัวอย่างมีความสูงน้อยกว่ามาก

Introduction to Linear Modeling in Python

การแสดงผลการแจกแจง

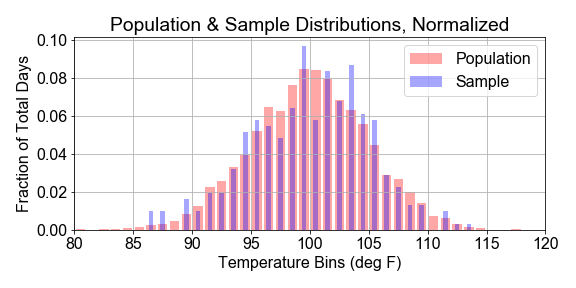
ฮิสโตแกรม 2 ภาพ แบ่งเป็นตัวอย่างและประชากร แสดงจำนวนวันที่ปรับค่าให้เป็นมาตรฐานเทียบกับช่วงอุณหภูมิ โดยความสูงของแท่งตัวอย่างใกล้เคียงกับประชากร

Introduction to Linear Modeling in Python

ความน่าจะเป็นและการอนุมาน

ฮิสโตแกรมแสดงจำนวนวันเทียบกับช่วงอุณหภูมิ อุณหภูมิสูงสุดในเดือนสิงหาคม

Introduction to Linear Modeling in Python

การแสดงผลการแจกแจง

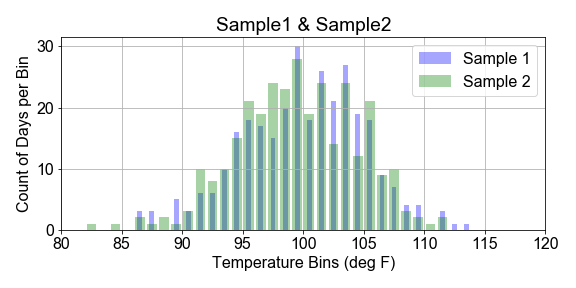
ฮิสโตแกรม 2 ภาพ แต่ละภาพแสดงตัวอย่างที่ต่างกัน แสดงจำนวนวันที่ปรับค่าให้เป็นมาตรฐานเทียบกับช่วงอุณหภูมิ ความสูงของแท่งใกล้เคียงกัน แต่ต่างกันเล็กน้อยในแต่ละช่วง

Introduction to Linear Modeling in Python

การสุ่มตัวอย่างซ้ำ

# Resampling as Iteration
num_samples = 20
for ns in range(num_samples):
    sample = np.random.choice(population, num_pts)
    distribution_of_means[ns] = sample.mean()
# Sample Distribution Statistics
mean_of_means = np.mean(distribution_of_means)
stdev_of_means = np.std(distribution_of_means)
Introduction to Linear Modeling in Python

มาฝึกกันเถอะ!

Introduction to Linear Modeling in Python

Preparing Video For Download...